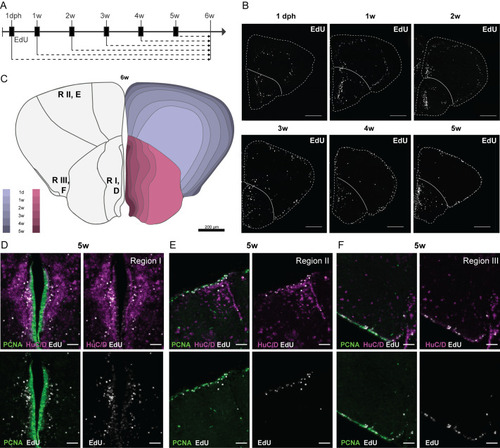
EdU tracing reveals a neuronal stacking process during telencephalic growth. (A) Design of the EdU birth-dating experiment. Each experimental group is exposed to 4 mM EdU for 16 h (black boxes) at different time points during development. EdU is incorporated into the DNA of dividing cells; their progeny are always traced until 6 weeks. (B) Distribution of EdU+ nuclei (white) on coronal sections at the mid-anterior-posterior level at 6 weeks. The timepoint of EdU administration is indicated above each panel. The outer border of the sections is indicated with a dashed line and the pallial-subpallial border with a solid line. In the pallium, EdU+ cells appear in concentric circles at differing distances from and parallel to the pallial surface. In the subpallium, the EdU+ cells appear more scattered, but the bulk of EdU+ cells seem to have migrated a comparable distance from the subpallial ventricular zone for each timepoint of EdU treatment. (C) Illustrative summary of the EdU tracing experiment. The opposite stacking process of the pallium and subpallium is color-coded for each period. The location of the pictures in D-F [neurogenic region (R) I, II, III] is indicated on the left hemisphere. (D-F) Zoom-in on EdU+ cells at each neurogenic region upon EdU treatment at 5 weeks. The EdU staining (white) is combined with an immunohistochemical staining for HuC/D (magenta) and PCNA (green). After 1 week of tracing from 5 weeks, the EdU signal is visible in the PCNA+ progenitor cells and HuC/D+ neurons at a distance from the ventricular zone. Note that region I contains more EdU+/HUC/D+ cells than regions II and III. A varying degree of EdU intensity is observed in the PCNA+ progenitors. Scale bars: 200 µm (B); 50 µm (D-F).
|
