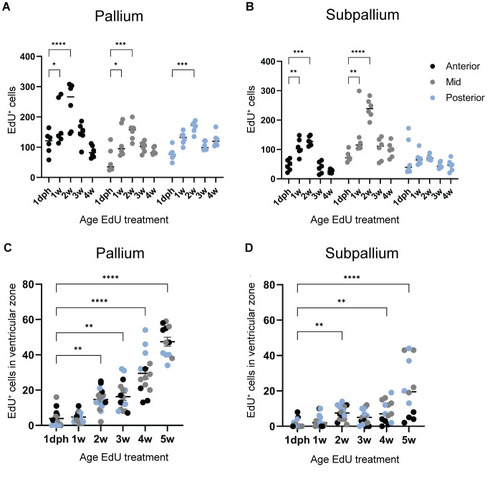
Different pallial and subpallial growth dynamics identified by EdU tracing. (A,B) The absolute number of EdU+ cells was quantified in 6-week-old coronal sections for both pallial (A) and subpallial (B) regions. Sections spanning the anterior-posterior axis were categorized into three levels: anterior, mid and posterior. Quantification was performed at each level for six individual hemispheres (n=6) from three fish per time point. Statistical analysis was conducted using a two-way ANOVA followed by post-hoc multiple comparisons against 1 dph. (C,D) To evaluate EdU label retention in progenitor cells, EdU+ cells located one to two cell bodies from the pallial ventricular surface (C) and subpallial midline (D) were quantified for each timepoint after tracing until 6 weeks. Quantifications were performed using individual hemispheres spanning the anterior-posterior axis. A minimum of two fish were used per time point (1 dph, n=14; 1 weeks, n=14; 2 weeks, n=16; 3 weeks, n=16; 4 weeks, n=14; 5 weeks, n=12). Statistical analysis was conducted using a Kruskal–Wallis test with post-hoc multiple comparisons against 1 dph. *P<0.05, **P<0.01, ***P<0.001, ****P<0.0001.
|
