FIGURE SUMMARY
Title

KDM4C works in concert with GATA1 to regulate heme metabolism in head and neck squamous cell carcinoma

Authors
Wu, M.J., Yang, S.M., Fang, W.K., Chen, T.J., Wu, C.Y., Hsu, Y.J., Shen, C.E., Cheng, Y.C., Hsieh, W.C., Yuh, C.H., Yang, M.H., Kung, H.J., Wang, W.C.
Source
Full text @ Cell. Mol. Life Sci.

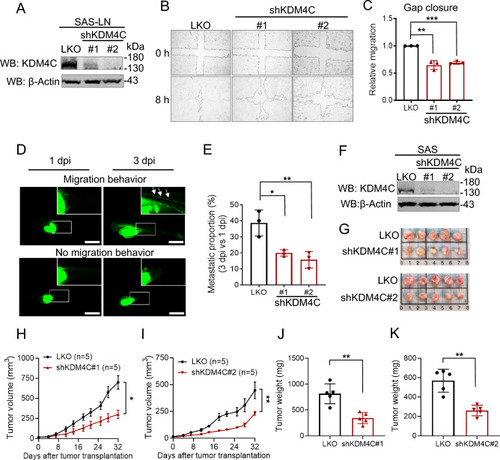
KDM4C promotes cell migration and is crucial for tumor growth in HNSCC. A Generation of KDM4C-knockdown (KDM4C-KD) SAS-LN cells. Cells were infected with lentivirus carrying control pLKO.1 (LKO), or shKDM4C constructs (#1 or #2), followed by puromycin selection. KDM4C expression was analyzed by Western blot. Actin was used as the internal control. B Wound healing assay of LKO and KDM4C-KD SAS-LN cells. C Quantification of the wound closure area from (B). D Zebrafish xenotransplantation assay of LKO and KDM4C-KD SAS-LN cells. Representative fluorescence images of a zebrafish embryo displaying cell migration (upper, LKO) or no migration (lower, shKDM4C#1) at post-injection (dpi). Scale bar, 1 mm. E Quantification of cell migration in zebrafish xenograft from (D). Each data point represents the percentage of embryos exhibiting tumor cell migration at 3 dpi in one of three independent biological experiments. The total number of embryos analyzed per group is as follows: LKO (n = 33), shKDM4C#1 (n = 30), shKDM4C#2 (n = 32). F Generation of KDM4C-KD SAS cells. KDM4C expression was analyzed by Western blot. Actin was used as the internal control. G Examination of LKO and KDM4C-KD SAS cells (1×10⁶ cells) xenografted in BALB/cAnN.Cg-Foxn1nu/Croner mice. H, I Measurements of tumor volume were recorded twice a week. J, K Measurements of tumor weight were recorded at the sacrificed endpoint. Data in (C, E) are represented as individual points and mean, and data in (H, I) are mean ± SEM. P-values are determined by two-sided Student’s t-test (J, K), one-way ANOVA with Tukey’s multiple comparisons test (C, E), or two-way ANOVA with Tukey’s multiple comparisons test (H, I). *P < 0.05, **P < 0.01, ***P < 0.001, ns not significant

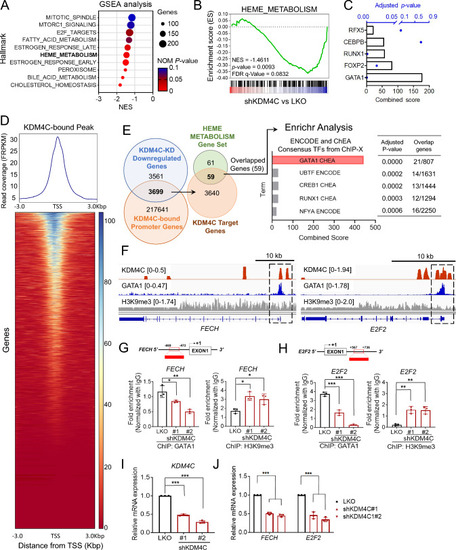
Heme-metabolism genes are regulated by KDM4C and GATA1. A Top six KDM4C-correlated pathways from GSEA analysis of KDM4C knockdown (KD) RNA-seq result. B KDM4C-KD SAS cells enrich for gene signatures characteristic of heme-metabolism loss, as identified by mRNA-seq followed by GSEA. C Enrichr analysis of key transcription factors in heme-metabolism genes derived from (A). D Global binding profile of KDM4C at transcription start sites (TSSs) within ±3 kb regions, visualized as a heatmap and peak density plot derived from KDM4C CUT&Tag-seq analysis. The heatmap highlights the binding intensity of KDM4C across TSSs, with color gradients representing varying binding levels. Data visualization was generated using the Galaxy plot heatmap tool, allowing for a clear illustration of KDM4C enrichment at promoter regions, indicative of its regulatory role in gene expression. E Identification of heme metabolism genes regulated by KDM4C. The Venn diagram depicts the overlap between KDM4C-downregulated genes and KDM4C-bound promoter genes. The intersecting set represents KDM4C-regulated genes involved in heme metabolism. An Enrichr analysis (https://maayanlab.cloud/Enrichr/) was performed on these genes to identify consensus transcription factors, with GATA1 emerging as the top-ranking transcription factor, highlighted in the enrichment bar chart to indicate its pivotal role in the KDM4C regulatory network. F KDM4C (this study), GATA1 (SRX4172742_HCT116), and H3K9me3 (ENCFF794 WNF) at proximal promoter regions of FECH and E2F2. G, H Analysis of occupancy changes at the promoter region of FECH (G) and E2F2 (H) via ChIP-qPCR. ChIP was conducted with specific antibodies (anti-GATA1 and anti-H3K9me3) in LKO and KDM4C-KD SAS cells. I, J The relative mRNA levels of heme-metabolism genes (FECH and E2F2) in the LKO and KDM4C-KD SAS cells. Data in (GJ) are represented in individual points and mean. P-values are determined by one-way ANOVA with Tukey’s multiple comparisons test (GI), or two-way ANOVA with Tukey’s multiple comparisons test (J). *P < 0.05, **P < 0.01, ***P < 0.001, ns not significant

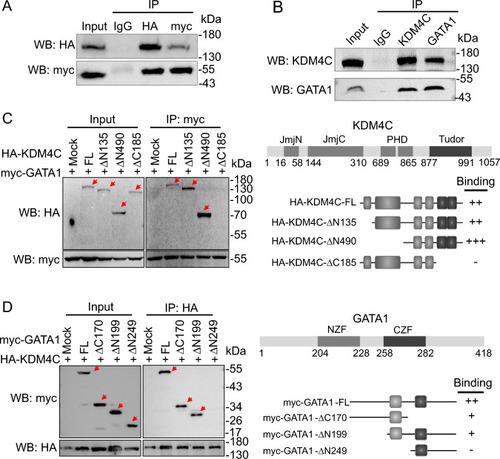
The interaction of KDM4C and GATA1. A Association of ectopically expressed KDM4C and GATA1. Western blot analysis of HEK293T cells co-transfected with pcDNA3.1-HA-KDM4C and pcDNA3.1-myc-his-GATA1 as indicated. Immunoprecipitation (IP) was conducted using anti-HA or anti-myc antibody. Rabbit/mouse IgG (1:1) was used as a negative control. B Western blot analysis of endogenous IP in SAS cells. IP was conducted using anti-KDM4C or anti-GATA1 antibody. Rabbit IgG was used as negative control. C Co-IP assays were performed with an anti-myc antibody in lysates from HEK293T cells co-transfected with a full-length (FL) myc-GATA1 vector plus one of the HA-tagged constructs [mock, full-length (FL) KDM4C, or KDM4C truncated mutants (∆N135, ∆N490 and ∆C185)], followed by western blot analysis. D Co-IP assays were performed with an anti-HA antibody in lysates from HEK293T cells co-transfected with a full-length (FL) HA-KDM4C vector plus one of the myc-tagged constructs [mock, full-length (FL) GATA1, or GATA1 truncated mutants (∆C170, ∆N199 and ∆N249)], followed by western blot analysis

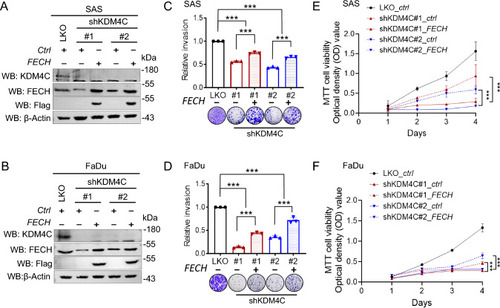
Effect of FECH overexpression on invasion and proliferation in KDM4C-knockdown SAS and FaDu cells. A, B Analysis of FECH expression in LKO and KDM4C-knockdown (shKDM4C#1 or #2) SAS (A) and FaDu (B) cells. Cells were transfected with control or Flag-FECH expression vector, followed by Western blot analysis. C, D Invasion assay of LKO and FECH-overexpressing KDM4C-KD SAS (C) and FaDu (D) cells. E, F MTT cell proliferation assay of LKO and FECH-overexpressing KDM4C-KD SAS (E) and FaDu (F) cells at indicated time points. Data in (C, D) are represented in individual points and mean, and data in (E, F) are mean ± SD. P-values are determined by one-way ANOVA with Tukey’s multiple comparisons test (C, D) and two-way ANOVA with Tukey’s multiple comparisons test (E, F). *P < 0.05, **P < 0.01, ***P < 0.001, ns not significant

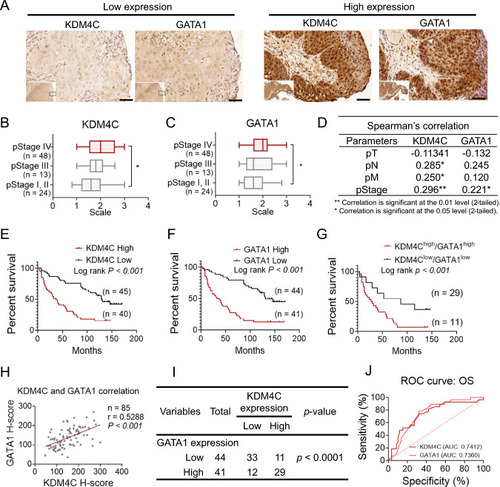
Correlation and clinical impact of KDM4C and GATA1 expression in HNSCC. A Representative immunohistochemical staining for KDM4C and GATA1 in tumor slides from HNSCC patients. Scale bar = 50 μm. B, C Distribution of KDM4C and GATA1 staining intensity across different pStage groups. D Spearman’s correlation analysis of KDM4C and GATA1 expression with clinical stages in HNSCC (pT: primary tumor extent, pN: regional lymph node metastasis, pM: distant metastasis). EG Kaplan-Meier survival curves demonstrating the association of high expression of KDM4C (E), GATA1 (F), and both (G) with reduced overall survival in HNSCC patients. Grouping is based on H-score averages for high/low expression. H Pearson correlation analysis between KDM4C expression and GATA1 levels in 85 HNSCC cases. I Chi-square test assessing the statistical significance of the correlation between KDM4C and GATA1. J Receiver operating characteristic (ROC) curve analysis evaluating the diagnostic potential of KDM4C and GATA1 in HNSCC. P-values are determined by a two-tailed Student’s t-test for group comparisons (A, B). *P < 0.05, **P < 0.01, ***P < 0.001, ns not significant

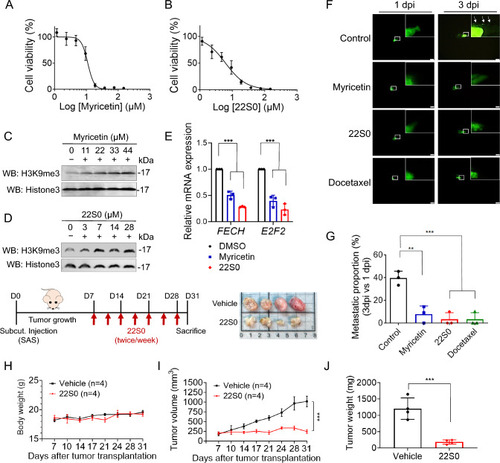
Effects of KDM4 inhibitors on heme metabolism and tumor growth in HNSCC. A, B SAS-LN cells were treated with varying concentrations of myricetin (A) or 22S0 (B) for 3 days. Cell survival rates were measured using the MTT assay and are shown as dose-response curves. C, D Analysis of H3K9me3 levels in inhibitor-treated SAS-LN cells for 3 days. The H3K9me3 signals were detected by Western blot analysis. E Relative mRNA levels of heme metabolism genes (FECH and E2F2) in SAS-LN cells following 24-hour treatment with control (DMSO, 0.1%), myricetin (12.5 µM), or 22S0 (6.25 µM). F Representative images of SAS-LN cells xenografted in zebrafish and treated with drugs. Treatments include control (DMSO, 0.1%), myricetin (11.07 µM), 22S0 (6.17 µM), and docetaxel (0.38 nM). Scale bar: 200 µm. G Quantification of cell migration of SAS-LN cells under various drug treatments from (F). Each data point represents the percentage of embryos exhibiting tumor cell migration at 3 dpi in one of three independent biological experiments. The total number of embryos analyzed per group is as follows: control (n = 33), myricetin (n = 41), 22S0 (n = 32), and docetaxel (n = 31). HJ SAS cells (1×10⁶ cells) were subcutaneously injected into the BALB/cAnN.Cg-Foxn1nu/CrlNarl mice. When the tumors had grown to approximately 100 mm3, the mice received treatment. They were given two injections per week, with either 75 mg/kg of 22S0 or a control vehicle solution (DMSO/PEG300/PBS), administered via intra-tumor injection. Tumor volumes (H) and body weights (I) were measured at each treatment session, and tumor weights were measured at sacrificed endpoint (J). Data in (E, G, J) are represented as individual points and mean. Data in (A, B) are represented in mean ± SD, and data in (H, I) are mean ± SEM. P-values are determined by two-way ANOVA with Tukey’s multiple comparisons test (E, I), one-way ANOVA with Tukey’s multiple comparisons test (G), and two-tailed Student’s t–test (J). *P < 0.05, **P < 0.01, ***P < 0.001, ns not significant

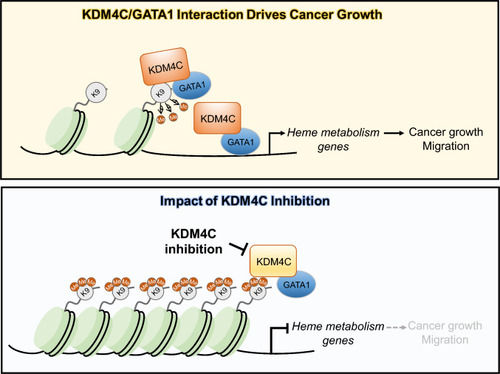
Schematic illustration of KDM4C-GATA1 axis in heme metabolism and cancer progression. In the active state (top panel), KDM4C interacts with GATA1, demethylating H3K9me3 marks at heme metabolism gene promoters such as FECH, opening chromatin, and promoting gene transcription. This upregulation supports cancer cell growth and migration. Upon KDM4C inhibition (bottom panel), H3K9me3 demethylation is blocked, leading to a repressive chromatin state, downregulating heme metabolism genes, and reducing cancer growth and migration

Acknowledgments
This image is the copyrighted work of the attributed author or publisher, and ZFIN has permission only to display this image to its users. Additional permissions should be obtained from the applicable author or publisher of the image. Full text @ Cell. Mol. Life Sci.