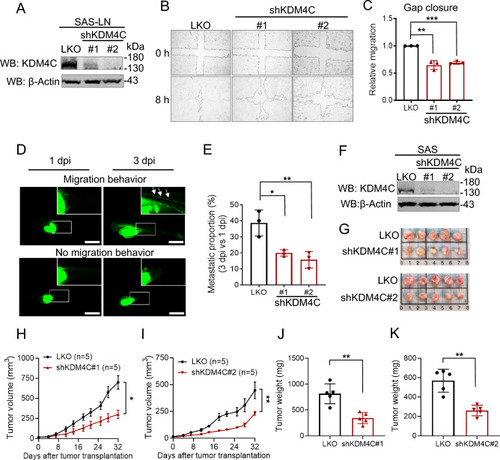
KDM4C promotes cell migration and is crucial for tumor growth in HNSCC. A Generation of KDM4C-knockdown (KDM4C-KD) SAS-LN cells. Cells were infected with lentivirus carrying control pLKO.1 (LKO), or shKDM4C constructs (#1 or #2), followed by puromycin selection. KDM4C expression was analyzed by Western blot. Actin was used as the internal control. B Wound healing assay of LKO and KDM4C-KD SAS-LN cells. C Quantification of the wound closure area from (B). D Zebrafish xenotransplantation assay of LKO and KDM4C-KD SAS-LN cells. Representative fluorescence images of a zebrafish embryo displaying cell migration (upper, LKO) or no migration (lower, shKDM4C#1) at post-injection (dpi). Scale bar, 1 mm. E Quantification of cell migration in zebrafish xenograft from (D). Each data point represents the percentage of embryos exhibiting tumor cell migration at 3 dpi in one of three independent biological experiments. The total number of embryos analyzed per group is as follows: LKO (n = 33), shKDM4C#1 (n = 30), shKDM4C#2 (n = 32). F Generation of KDM4C-KD SAS cells. KDM4C expression was analyzed by Western blot. Actin was used as the internal control. G Examination of LKO and KDM4C-KD SAS cells (1×10⁶ cells) xenografted in BALB/cAnN.Cg-Foxn1nu/Croner mice. H, I Measurements of tumor volume were recorded twice a week. J, K Measurements of tumor weight were recorded at the sacrificed endpoint. Data in (C, E) are represented as individual points and mean, and data in (H, I) are mean ± SEM. P-values are determined by two-sided Student’s t-test (J, K), one-way ANOVA with Tukey’s multiple comparisons test (C, E), or two-way ANOVA with Tukey’s multiple comparisons test (H, I). *P < 0.05, **P < 0.01, ***P < 0.001, ns not significant
|
