IMAGE

Fig. 2

ID
ZDB-IMAGE-250423-79
Source
Figures for Wu et al., 2025
Image
Figure Caption

Fig. 2

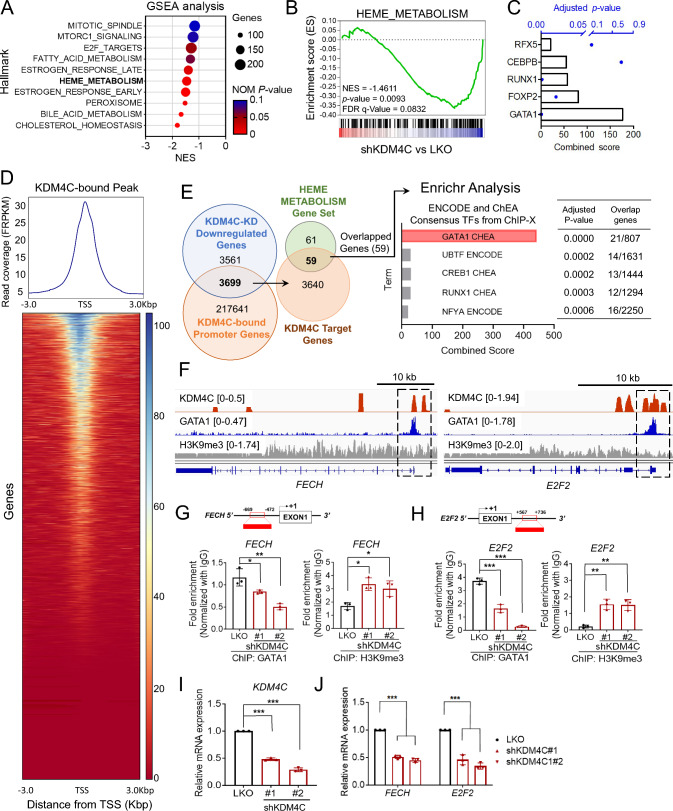
Heme-metabolism genes are regulated by KDM4C and GATA1. A Top six KDM4C-correlated pathways from GSEA analysis of KDM4C knockdown (KD) RNA-seq result. B KDM4C-KD SAS cells enrich for gene signatures characteristic of heme-metabolism loss, as identified by mRNA-seq followed by GSEA. C Enrichr analysis of key transcription factors in heme-metabolism genes derived from (A). D Global binding profile of KDM4C at transcription start sites (TSSs) within ±3 kb regions, visualized as a heatmap and peak density plot derived from KDM4C CUT&Tag-seq analysis. The heatmap highlights the binding intensity of KDM4C across TSSs, with color gradients representing varying binding levels. Data visualization was generated using the Galaxy plot heatmap tool, allowing for a clear illustration of KDM4C enrichment at promoter regions, indicative of its regulatory role in gene expression. E Identification of heme metabolism genes regulated by KDM4C. The Venn diagram depicts the overlap between KDM4C-downregulated genes and KDM4C-bound promoter genes. The intersecting set represents KDM4C-regulated genes involved in heme metabolism. An Enrichr analysis (https://maayanlab.cloud/Enrichr/) was performed on these genes to identify consensus transcription factors, with GATA1 emerging as the top-ranking transcription factor, highlighted in the enrichment bar chart to indicate its pivotal role in the KDM4C regulatory network. F KDM4C (this study), GATA1 (SRX4172742_HCT116), and H3K9me3 (ENCFF794 WNF) at proximal promoter regions of FECH and E2F2. G, H Analysis of occupancy changes at the promoter region of FECH (G) and E2F2 (H) via ChIP-qPCR. ChIP was conducted with specific antibodies (anti-GATA1 and anti-H3K9me3) in LKO and KDM4C-KD SAS cells. I, J The relative mRNA levels of heme-metabolism genes (FECH and E2F2) in the LKO and KDM4C-KD SAS cells. Data in (GJ) are represented in individual points and mean. P-values are determined by one-way ANOVA with Tukey’s multiple comparisons test (GI), or two-way ANOVA with Tukey’s multiple comparisons test (J). *P < 0.05, **P < 0.01, ***P < 0.001, ns not significant

Acknowledgments
This image is the copyrighted work of the attributed author or publisher, and ZFIN has permission only to display this image to its users. Additional permissions should be obtained from the applicable author or publisher of the image. Full text @ Cell. Mol. Life Sci.