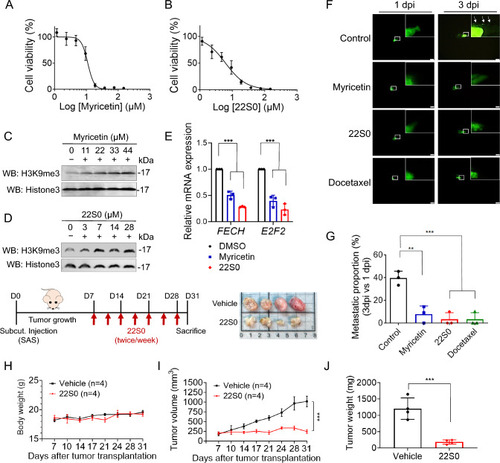
Effects of KDM4 inhibitors on heme metabolism and tumor growth in HNSCC. A, B SAS-LN cells were treated with varying concentrations of myricetin (A) or 22S0 (B) for 3 days. Cell survival rates were measured using the MTT assay and are shown as dose-response curves. C, D Analysis of H3K9me3 levels in inhibitor-treated SAS-LN cells for 3 days. The H3K9me3 signals were detected by Western blot analysis. E Relative mRNA levels of heme metabolism genes (FECH and E2F2) in SAS-LN cells following 24-hour treatment with control (DMSO, 0.1%), myricetin (12.5 µM), or 22S0 (6.25 µM). F Representative images of SAS-LN cells xenografted in zebrafish and treated with drugs. Treatments include control (DMSO, 0.1%), myricetin (11.07 µM), 22S0 (6.17 µM), and docetaxel (0.38 nM). Scale bar: 200 µm. G Quantification of cell migration of SAS-LN cells under various drug treatments from (F). Each data point represents the percentage of embryos exhibiting tumor cell migration at 3 dpi in one of three independent biological experiments. The total number of embryos analyzed per group is as follows: control (n = 33), myricetin (n = 41), 22S0 (n = 32), and docetaxel (n = 31). H‒J SAS cells (1×10⁶ cells) were subcutaneously injected into the BALB/cAnN.Cg-Foxn1nu/CrlNarl mice. When the tumors had grown to approximately 100 mm3, the mice received treatment. They were given two injections per week, with either 75 mg/kg of 22S0 or a control vehicle solution (DMSO/PEG300/PBS), administered via intra-tumor injection. Tumor volumes (H) and body weights (I) were measured at each treatment session, and tumor weights were measured at sacrificed endpoint (J). Data in (E, G, J) are represented as individual points and mean. Data in (A, B) are represented in mean ± SD, and data in (H, I) are mean ± SEM. P-values are determined by two-way ANOVA with Tukey’s multiple comparisons test (E, I), one-way ANOVA with Tukey’s multiple comparisons test (G), and two-tailed Student’s t–test (J). *P < 0.05, **P < 0.01, ***P < 0.001, ns not significant
|
