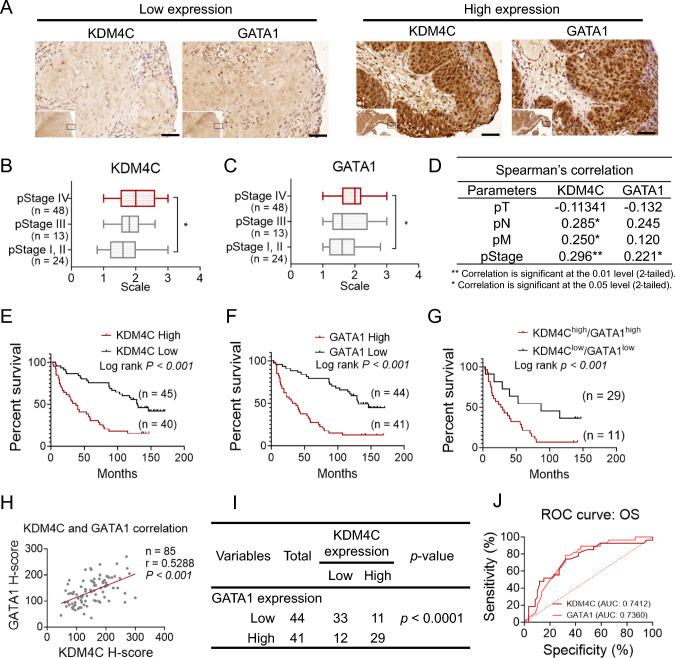
Correlation and clinical impact of KDM4C and GATA1 expression in HNSCC. A Representative immunohistochemical staining for KDM4C and GATA1 in tumor slides from HNSCC patients. Scale bar = 50 μm. B, C Distribution of KDM4C and GATA1 staining intensity across different pStage groups. D Spearman’s correlation analysis of KDM4C and GATA1 expression with clinical stages in HNSCC (pT: primary tumor extent, pN: regional lymph node metastasis, pM: distant metastasis). E‒G Kaplan-Meier survival curves demonstrating the association of high expression of KDM4C (E), GATA1 (F), and both (G) with reduced overall survival in HNSCC patients. Grouping is based on H-score averages for high/low expression. H Pearson correlation analysis between KDM4C expression and GATA1 levels in 85 HNSCC cases. I Chi-square test assessing the statistical significance of the correlation between KDM4C and GATA1. J Receiver operating characteristic (ROC) curve analysis evaluating the diagnostic potential of KDM4C and GATA1 in HNSCC. P-values are determined by a two-tailed Student’s t-test for group comparisons (A, B). *P < 0.05, **P < 0.01, ***P < 0.001, ns not significant
Acknowledgments
This image is the copyrighted work of the attributed author or publisher, and
ZFIN has permission only to display this image to its users.
Additional permissions should be obtained from the applicable author or publisher of the image.
Full text @ Cell. Mol. Life Sci.
Your Input Welcome
Thank you for submitting comments. Your input has been emailed to ZFIN curators who may contact you if
additional information is required.
Oops. Something went wrong. Please try again later.