
- Title
-
Retinoic acid promotes second heart field addition and regulates ventral aorta patterning in zebrafish
- Authors
- Griffin, A.H.C., Small, A.M., Johnson, R.D., Medina, A.M., Kollar, K.T., Nazir, R.A., McGuire, A.M., Schumacher, J.A.
- Source
- Full text @ Dev. Biol.
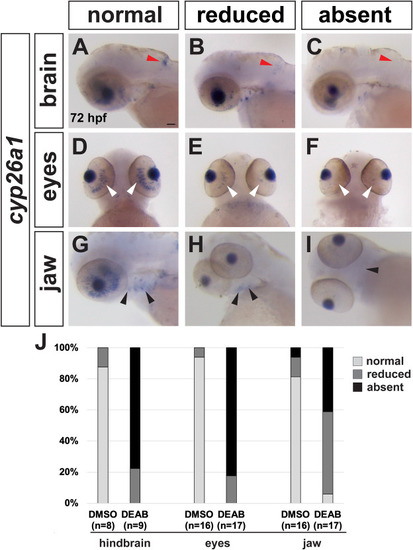
Cyp26a1 expression is reduced in embryos treated with DEAB from 26 hpf to 72 hpf. cyp26a1 expression in the hindbrain (A-C, red arrowheads), eyes (D-F, white arrowheads) and jaw (G-I, black arrowheads) is strongly reduced or absent in DEAB-treated embryos. J shows quantification of expression in each domain. All embryos are 72 hpf. Scale bar is 50 ?M. (For interpretation of the references to colour in this figure legend, the reader is referred to the Web version of this article.) |
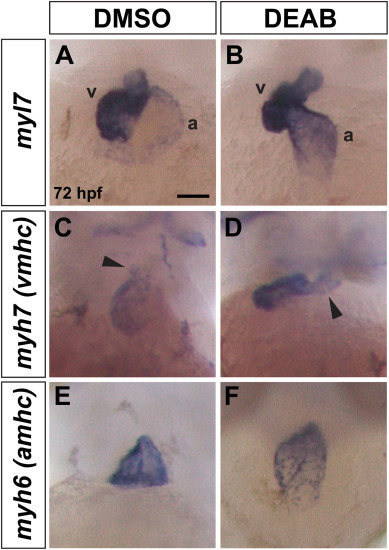
Heart morphology is abnormal in late RA-deficient embryos. (A, B) myl7 expression is similar in the ventricle (v) and atrium (a) of control (n = 35/35 have normal morphology as shown) and DEAB-treated embryos (n = 27/37 have elongated, linear morphology as shown, 10/37 have more horizontal chamber placement as seen in controls). (C, D) myh7 expression is present in the ventricle of DEAB-treated embryos (n = 31), but the ventricle is more compact with an elongated OFT region compared to the controls (n = 23). For control embryos, 21/23 have short OFT as shown, 2/23 have elongated OFT. For DEAB-treated embryos, 10/31 have short OFT, 21/31 have elongated OFT as shown. (E, F) myh6 expression is present in the atrium of DEAB-treated embryos but the chamber morphology is abnormal compared to controls. For control embryos, 48/48 have normal morphology as shown. For DEAB-treated embryos, 32/39 have variable abnormal elongated morphology. All embryos are 72 hpf. Scale bar is 50 ?M. |
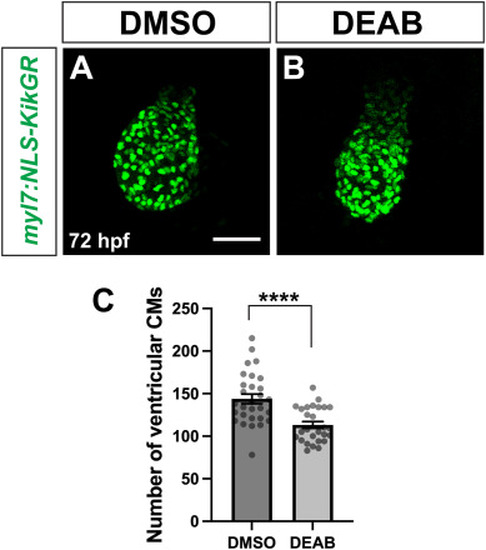
Ventricular cardiomyocyte number is reduced in late RA-deficient embryos. (A, B) Representative images of my7:NLS-KikGR expression in the ventricle of control DMSO (A) and DEAB-treated (B) embryos at 72 hpf. Note that expression is absent in the atrium, preventing analysis of that chamber. Maximum intensity projections of a Z-stack are shown for each image. Scale bar is 50 ?M. (C) Number of ventricular cardiomyocytes at 72 hpf in control (n = 29) and DEAB-treated (n = 27) embryos. Error bars represent SEM. ???? indicates p < 0.0001. |
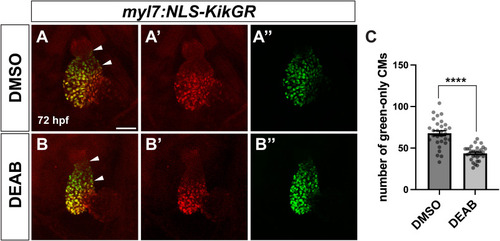
SHF addition to the arterial pole of the ventricle is reduced in late RA-deficient embryos. (A, B) Representative images of temporal differentiation assay using the myl7:NLS-KikGR transgene in control DMSO (A) and DEAB-treated (B) embryos. White arrowheads indicate region of green-only later-differentiating cardiomyocytes of the SHF at the arterial pole. (A?, B?) Red channel only. (A?, B?) Green channel only. Maximum intensity projections of a Z-stack are shown for each image. Scale bar is 50 ?M. (C) Quantification of green-only cardiomyocytes at 72 hpf in control (n = 30) and DEAB-treated (n = 32) embryos. Error bars represent SEM. ???? indicates p < 0.0001. (For interpretation of the references to colour in this figure legend, the reader is referred to the Web version of this article.) |

The SHF progenitor pool is present, and apoptosis is not increased in late RA-deficient embryos. (A?B) ltbp3 expression in embryos treated with DMSO or DEAB from 26 hpf to 33 hpf. (C, D) Activated Caspase-3 distribution (green) at 32 hpf in the heart (indicated by MF20 staining in red) and adjacent regions in embryos treated with DMSO (n = 26/28 with no staining in heart) or DEAB (n = 27/29 with no staining in heart). White ovals outline the heart region, V indicates ventricle region of heart tube. (E, F) Activated Caspase-3 distribution at 48 hpf in the heart and adjacent regions in embryos treated with DMSO (n = 21/21 with no staining in the heart) or DEAB (n = 16/18 with no staining in the heart). (G, H) Activated Caspase-3 distribution at 72 hpf in the heart and adjacent regions in embryos treated with DMSO (n = 31/32 as shown) or DEAB (n = 31/32 as shown). White circles outline the ventricle and OFT region in E-H. Maximum intensity projections of a Z-stack are shown for each image. Anterior is to the left. Scale bars are 50 ?M. (For interpretation of the references to colour in this figure legend, the reader is referred to the Web version of this article.) |
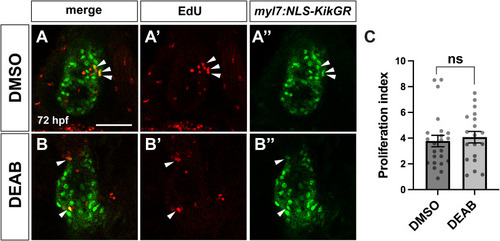
Ventricular cardiomyocyte proliferation is unchanged in late RA-deficient embryos (A, B) Representative images of EdU staining in control DMSO (A) and DEAB-treated (B) embryos at 72 hpf. (A?, B?) EdU in red and (A?, B?) myl7:NLS-KikGR transgene expression in cardiomyocytes shown in green. Arrowheads indicate EdU+/NLS-KikGR + cardiomyocytes. Single confocal sections are shown. Scale bar is 50 ?M. (C) Proliferation indices for DMSO (n = 23) and DEAB-treated (n = 19) embryos. (For interpretation of the references to colour in this figure legend, the reader is referred to the Web version of this article.) |
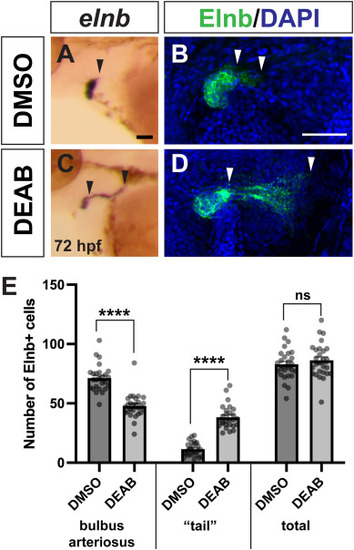
OFT smooth muscle distribution is altered in late RA-deficient embryos. (A, B) ISH for elnb expression in the OFT in control (n = 12) and DEAB-treated (n = 19) embryos at 72 hpf. Black arrowheads indicate posterior elnb expression domain. (C, D) Representative images of immunostaining for Elnb protein in the OFT in control and DEAB-treated embryos at 72 hpf. Maximum intensity projections are shown. DAPI marks all nuclei in blue, Elnb expression is shown in green. White arrowheads indicate boundaries of the ?tail?, or posterior Elnb expression domain. Maximum intensity projections of a Z-stack are shown for each image. (E) Quantification of Elnb expression in smooth muscle cells of the BA, ?tail? region, and total cell number in DMSO (n = 26) and DEAB-treated (n = 27) embryos. Scale bars are 50 ?M, anterior to the left in all images. Error bars represent SEM. ???? indicates p < 0.0001, ns = not significant. (For interpretation of the references to colour in this figure legend, the reader is referred to the Web version of this article.) |
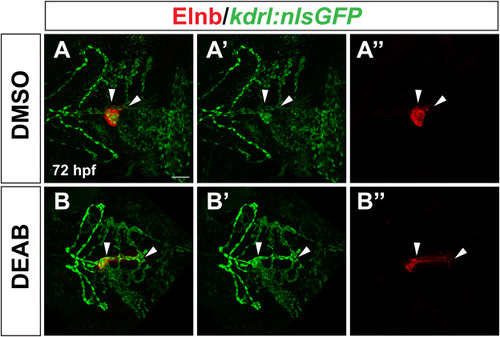
The expanded posterior smooth muscle domain in late RA-deficient embryos surrounds an elongated posterior branch of the ventral aorta. Representative images of kdrl:nlsGFP expression detected by immunostaining in endothelial cells (A?, B?), Elnb expression in OFT smooth muscle (A?, B?), and the merged images (A, B). n = 16 for DMSO control, n = 24 for DEAB. White arrowheads indicate the posterior region of the ventral aorta in A? and B?, the posterior ?tail? of Elnb expression in A? and B?, and the overlap of expression where the posterior Elnb domain surrounds the posterior region of the ventral aorta in A and B. Maximum intensity projections of a Z-stack are shown for each image. Scale bar is 50 ?M, anterior is to the left in all images. |
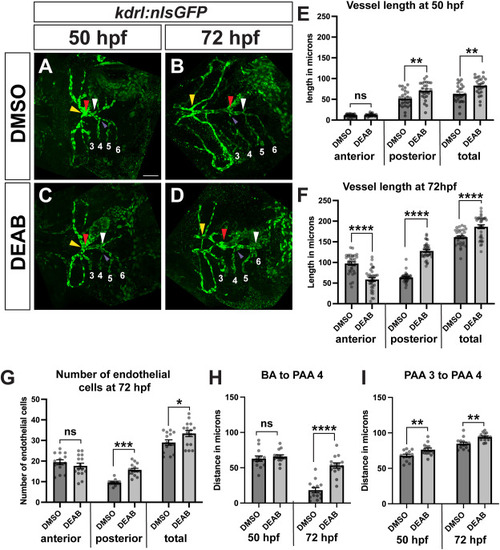
The posterior ventral aorta domain is expanded in late RA-deficient embryos. (A?D) Representative images of immunostaining to detect kdrl:nlsGFP expression in endothelial cells at 50 hpf (A, C) and 72 hpf (B, D) in control and DEAB-treated embryos. Red arrowheads indicate center of the BA, which represents the boundary between anterior and posterior segments, yellow arrowheads indicate anterior end of fused ventral aorta, white arrowheads indicate posterior end of ventral aorta. Numbers indicate PAA positions. Purple arrowheads indicate the junction of PAA 4 and the ventral aorta. For all analyses, the distance between the yellow arrowhead and the red arrowhead represents the length of the anterior segment, and the distance between the white arrowhead and the red arrowhead represents the length of the posterior segment. (E) Quantification of ventral aorta lengths at 50 hpf in control (n = 25) and DEAB-treated (n = 25) embryos. (F) Quantification of ventral aorta lengths at 72 hpf in control (n = 33) and DEAB-treated (n = 34) embryos. (G) Quantification of distance between the OFT and PAA 4 at 50 hpf in control (n = 13) and DEAB-treated (n = 14) embryos and 72 hpf in control (n = 14) and DEAB-treated (n = 14) embryos. (H) Quantification of distance between PAA 3 and PAA 4 at 50 hpf in control (n = 13) and DEAB-treated (n = 14) embryos and 72 hpf in control (n = 14) and DEAB-treated (n = 14) embryos. (I) Endothelial cell number in ventral aorta segments at 72 hpf in control (n = 14) and DEAB-treated (n = 15) embryos. Scale bar is 50 ?M. Error bars represent SEM. ???? indicates p < 0.0001, ??? indicates p < 0.001, ?? indicates p < 0.01, ? indicates p < 0.05, ns = not significant. (For interpretation of the references to colour in this figure legend, the reader is referred to the Web version of this article.) |
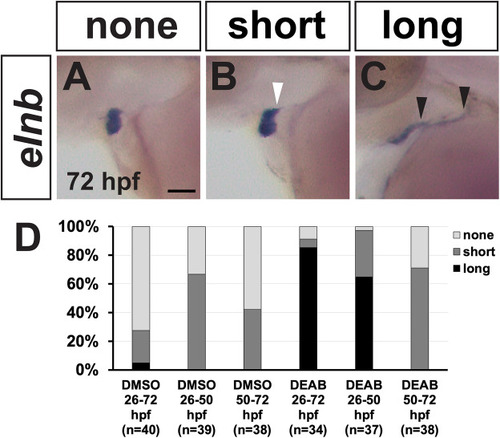
RA acts between 26 hpf and 50 hpf to pattern OFT smooth muscle. (A?C) Images of elnb ISH representing none, short, and long categories at 72 hpf. White arrow indicates small posterior elnb extension of the ?short? category. Black arrowheads indicate length of expanded elnb posterior expression of the ?long? category. Anterior is to the left. Scale bar is 50 ?M. (D) Quantification of phenotype categories for embryos treated with DMSO or DEAB for either 26 hpf ? 72 hpf, 26 hpf ? 50 hpf, or 50 hpf ? 72 hpf. |
Reprinted from Developmental Biology, , Griffin, A.H.C., Small, A.M., Johnson, R.D., Medina, A.M., Kollar, K.T., Nazir, R.A., McGuire, A.M., Schumacher, J.A., Retinoic acid promotes second heart field addition and regulates ventral aorta patterning in zebrafish, , Copyright (2025) with permission from Elsevier. Full text @ Dev. Biol.