
- Title
-
Sculponeatin A induces mitochondrial dysfunction in non-small cell lung cancer through WWP2-mediated degradation of mitochondrial STAT3
- Authors
- Wan, F., Qian, C., Liu, X., Zhong, Y., Peng, W., Zhang, L., Zhan, X., Huang, Y., Zhang, C., Wang, J., Si, Y., Liu, Y.
- Source
- Full text @ Br. J. Pharmacol.
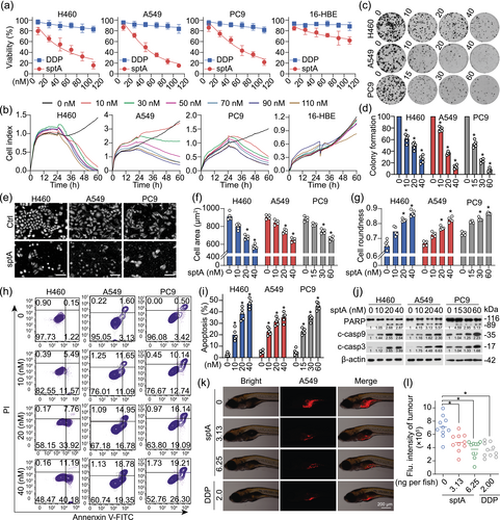
sptA inhibits growth and induces apoptosis in NSCLC cells. (a) The inhibitory effects of sptA on the growth of NSCLC cell lines and 16-HBE cells were evaluated with a CCK-8 assay (n = 5). (b) The inhibitory effects of sptA on the growth of NSCLC cell lines and 16-HBE cells were detected with an RTCA (n = 5). (c, d) Colony formation assays of NSCLC cell lines treated with sptA (n = 5). (e–g) Cell growth was assessed and imaged using high-content analysis (n = 5). The (f) area or (g) roundness of the cells was analysed using Harmony software (n = 5). Scale bar = 100 μm. (h, i) Cells were treated with sptA for 24 h and then asessed using annexin V/PI staining and flow cytometry (n = 5). (j) Cells were treated with sptA for 24 h, after which Western blot was performed (n = 5). (k, l) A549 xenograft zebrafish were treated with sptA or cisplatin at the indicated concentrations and observed at 2 dpi (n = 10). The intensity of red fluorescence is proportional to the tumour size. Data shown are individual values, with means ± SD. *P < 0.05, significantly different from control (0 nM sptA). DDP, cisplatin. |
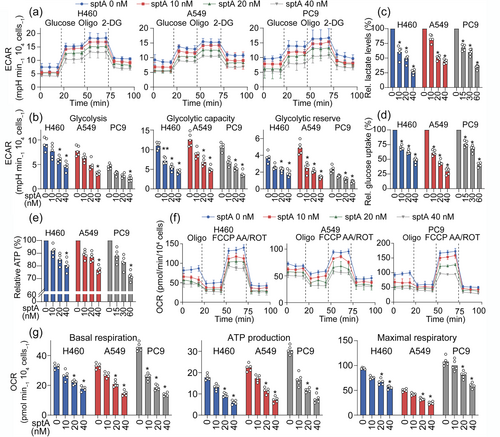
sptA inhibits aerobic glycolysis and mitochondrial respiration in NSCLC cells. (a, b) Cells were treated with sptA for 24 h, after which the ECAR was detected using a Seahorse XF24. Glycolysis, glycolytic capacity and the glycolytic reserve were quantified based on the ECAR (n = 5). (c, d) Cells were treated with sptA for 24 h. Lactate production (c) and glucose uptake (d) were measured (n = 5). (e-g) Cells were treated with sptA for 24 h, after which the OCR was determined using a Seahorse XF24. Basal respiration, ATP production and maximal respiration were quantified based on the OCR (n = 5). Data shown are means ± SD, with individual values in (b-e, g). *P < 0.05, significantly different from control (0 nM sptA). |
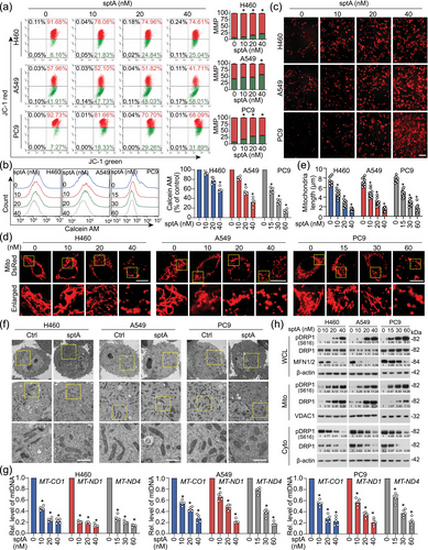
sptA induces mitochondrial dysfunction in NSCLC cells. (a) Cells were treated with sptA for 24 h and stained with JC-1 to assess the ΔΨm (n = 5). (b) Cells were treated with sptA for 24 h, and mPTP opening was measured with flow cytometry using calcein AM dye (n = 5). (c) Cells were treated with sptA for 24 h. Mitochondria were stained with MitoSOX™ red FM, and mtROS accumulation was observed using confocal microscopy (n = 5). Scale bar = 50 μm. (d) Cells were transfected with Mito-DsRed for 24 h and then treated with sptA for 24 h; the mitochondria were visualised using confocal microscopy (n = 10). Scale bar = 10 μm. (e) The average mitochondrial length was determined for 10 cells in each experiment. (f) Cells were incubated with sptA (H460: 40 nM; A549: 40 nM; PC9: 60 nM) for 24 h. Ultrastructural features of mitochondria were detected using TEM (n = 5). Scale bar = 1 μm. (g) Cells were treated with sptA for 24 h. mtDNA was isolated and then analysed using qPCR (n = 5). (h) Cells were treated with sptA for 24 h. The whole cell lysate (WCL), cytosolic (Cyto) and mitochondrial (Mito) fractions were isolated and then analysed using Western blot (n = 5). Data shown are means ± SD, with individual values in (b, e, g). *P < 0.05 significantly different from control (0 nM sptA). |
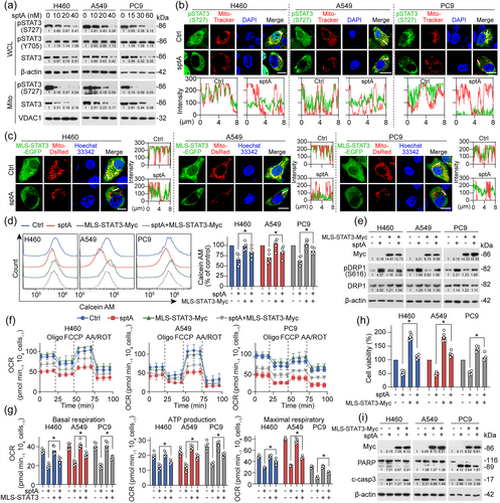
sptA induces mitochondrial dysfunction in NSCLC by down-regulating mitoSTAT3. (a) Cells were treated with sptA for 24 h. The WCL and Mito fractions were isolated and then analysed by Western blot (n = 5). (b) Cells were treated with sptA (H460: 40 nM; A549: 40 nM; PC9: 60 nM) for 24 h, and mitochondria were then stained with MitoTracker Red and analysed using an immunofluorescence assay (n = 5). Scale bar = 15 μm. (c) Cells were co-transfected with MLS-STAT3-EGFP and Mito-DsRed for 24 h, treated with sptA (H460: 40 nM; A549: 40 nM; PC9: 60 nM) for 24 h and then observed using live cell imaging (n = 5). Scale bar = 15 μm. (d) Cells were transfected with MLS-STAT3 for 24 h and then treated with sptA (H460: 40 nM; A549: 40 nM; PC9: 60 nM) for 24 h. mPTP opening was measured with flow cytometry using calcein AM dye (n = 5). (e–i) Cells were transfected with MLS-STAT3 for 24 h and then treated with sptA (H460: 40 nM; A549: 40 nM; PC9: 60 nM) for 24 h (n = 5). Then, Western blot was performed (e, i). The OCR was detected with a Seahorse XF24 (f, g), and cell viability was evaluated using a CCK-8 assay (h). Data shown are means ± SD, with individual values in (d, g, h). *P < 0.05, significantly different as indicated. |
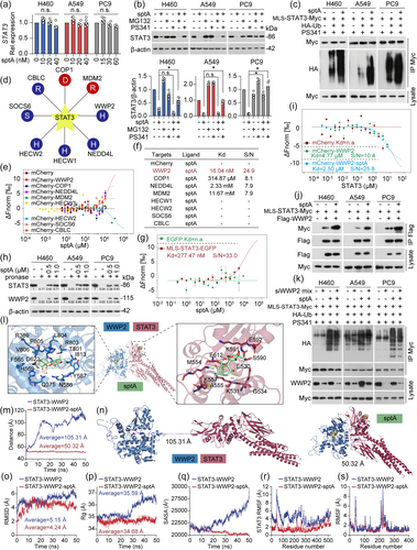
sptA reduces mitoSTAT3 protein stability through WWP2-mediated ubiquitination. (a) Cells were treated with sptA for 24 h. qPCR was then performed (n = 5). (b) Cells were treated with PS341 (50 nM)/MG132 (1 μM) for 1 h and then treated with sptA (H460: 40 nM; A549: 40 nM; PC9: 60 nM) for 24 h. Western blot was performed (n = 5). (c) Cells were transfected with MLS-STAT3-Myc and HA-Ub for 6 h, treated with sptA (H460: 40 nM; A549: 40 nM; PC9: 60 nM) for 24 h and lysed. The lysates were immunoprecipitated as indicated (n = 5). (d) UbiBrowser web services analyses ubiquitin ligases that mediate STAT3 protein ubiquitination. (e–g) A549 cells were transfected with mCherry-tagged ubiquitin ligase plasmids or EGFP tagged MLS-STAT3 construct, and total protein was extracted and then incubated with sptA (n = 5). The MST assay was performed to determine the binding affinity. (h) DARTS assays were performed to assess the stabilising effects of sptA and indicated proteins (n = 5). (i) The binding affinity of purified STAT3 protein to mCherry-WWP2 in A549 cells in the presence and absence of sptA was evaluated by MST assay (n = 5). (j) Cells were co-transfected with MLS-STAT3-Myc and Flag-WWP2 for 24 h, treated with sptA (H460: 40 nM; A549: 40 nM; PC9: 60 nM) for 24 h and lysed, and then co-IP was performed (n = 5). (k) Cells were transfected with WWP2 siRNA mix (siWWP2) for 24 h. Next, the cells were co-transfected with MLS-STAT3-Myc and HA-Ub for 6 h, treated with sptA (H460: 40 nM; A549: 40 nM; PC9: 60 nM) for 24 h. The lysates were immunoprecipitated as indicated (n = 5). (l) Docking pose of sptA with STAT3 and WWP2. (m) Changes in the distance between the centres of STAT3-WWP2 with/without sptA (n = 5). (n) Changes in the average distance between the centres of STAT3-WWP2 with/without sptA (n = 5). (o) Backbone RMSD values for STAT3-WWP2 in the presence or absence of sptA during a 50 ns simulation (n = 5). (p) Changes in the Rg values for STAT3-WWP2 in the presence or absence of sptA (n = 5). (q) SASA values of STAT3-WWP2 with/without sptA (n = 5). (r) Changes in the RMSF values of STAT3 for STAT3-WWP2 with/without sptA (n = 5). (s) Changes in the RMSF values of WWP2 for STAT3-WWP2 with/without sptA (n = 5). Data shown are means ± SD, with individual values in (a, b). *P < 0.05, significantly different as indicated; n.s., not significant. |
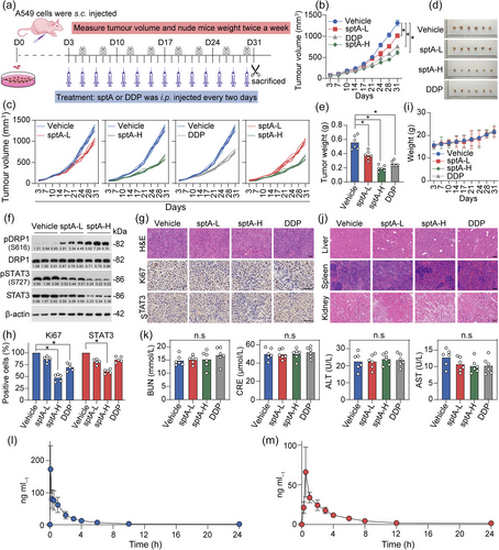
Inhibitory effect of sptA on xenograft tumours and its pharmacokinetic profile. (a) Diagram showing the xenograft tumour model construction. (b, c) Tumour volumes and weights of A549-xenografted nude mice after sptA-L (1.5 mg kg−1), sptA-H (3 mg kg−1) or cisplatin (6 mg kg−1) treatment (n = 6). (d) Images of xenograft tumours (n = 6). (e) Weights of the tumours obtained from the sacrificed mice (n = 6). (f) The expression levels of the indicated proteins in xenograft tumours were analysed using Western blot (n = 5). (g, h) Representative tumour tissues were sectioned and subjected to H&E staining and IHC staining (n = 5). Scale bar = 50 μm. (i) Body weights of the mice (n = 6). (j) The morphology of the liver, spleen and kidney of the mice was assessed with H&E staining (n = 5). (k) ALT, AST, CRE and BUN levels in mouse serum were measured (n = 6). (l) The concentration–time profiles of sptA after i.v. injection (1.5 mg kg−1) in SD rats (n = 5). (m) The concentration–time profiles of sptA after i.g. injection (6 mg kg−1) in SD rats (n = 5). Data shown are means ± SD, with individual values in (e, h, k). *P < 0.05, significantly different as indicated; n.s., not significant. |
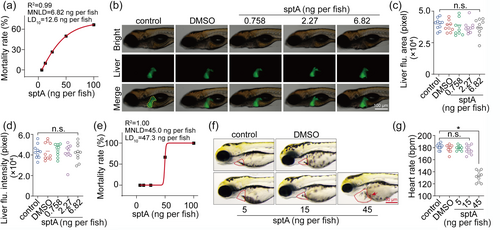
Toxicological evaluation of sptA in zebrafish. (a) Liver toxicity ‘dose-mortality’ curve of sptA in zebrafish (n = 10). (b) Typical diagram of zebrafish liver toxicity after sptA treatment (n = 10). (c, d) Liver fluorescence area and liver fluorescence analysis of the livers of sptA-treated zebrafish at 48 hpe (n = 10). (e) Heart toxicity ‘dose-mortality’ curve of sptA in zebrafish (n = 10). (f) Typical diagram of zebrafish heart toxicity after sptA treatment (n = 10). (g) Heart rate of zebrafish treated with sptA for 48 hpe (n = 10). Data shown are means ± SD, with individual values in (c, d, g). *P < 0.05, significantly different as indicated, n.s., not significant. |
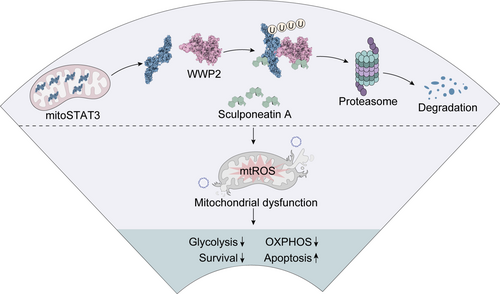
Schematic representation of the mechanism of action of sptA. sptA directly binds to mitoSTAT3 and ubiquitin ligase WWP2, promoting the binding of WWP2 to mitoSTAT3, thereby inducing mitoSTAT3 ubiquitination and proteasome degradation. The degradation of mitoSTAT3 leads to a decrease in its mitochondrial localisation, inducing mitochondrial dysfunction in NSCLC cells, thereby inhibiting the growth of NSCLC cells. |