
|
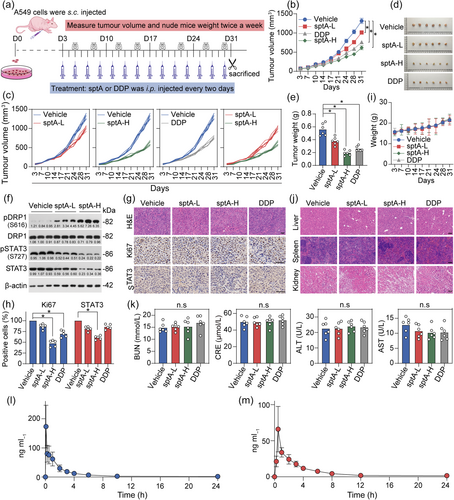
Fig. 6 Inhibitory effect of sptA on xenograft tumours and its pharmacokinetic profile. (a) Diagram showing the xenograft tumour model construction. (b, c) Tumour volumes and weights of A549-xenografted nude mice after sptA-L (1.5 mg kg−1), sptA-H (3 mg kg−1) or cisplatin (6 mg kg−1) treatment (n = 6). (d) Images of xenograft tumours (n = 6). (e) Weights of the tumours obtained from the sacrificed mice (n = 6). (f) The expression levels of the indicated proteins in xenograft tumours were analysed using Western blot (n = 5). (g, h) Representative tumour tissues were sectioned and subjected to H&E staining and IHC staining (n = 5). Scale bar = 50 μm. (i) Body weights of the mice (n = 6). (j) The morphology of the liver, spleen and kidney of the mice was assessed with H&E staining (n = 5). (k) ALT, AST, CRE and BUN levels in mouse serum were measured (n = 6). (l) The concentration–time profiles of sptA after i.v. injection (1.5 mg kg−1) in SD rats (n = 5). (m) The concentration–time profiles of sptA after i.g. injection (6 mg kg−1) in SD rats (n = 5). Data shown are means ± SD, with individual values in (e, h, k). *P < 0.05, significantly different as indicated; n.s., not significant.