
|
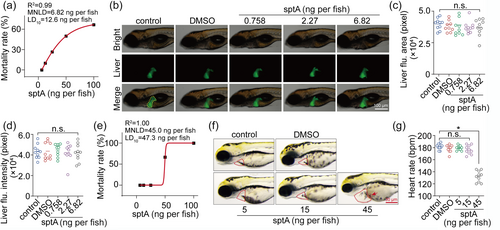
Fig. 7 Toxicological evaluation of sptA in zebrafish. (a) Liver toxicity ‘dose-mortality’ curve of sptA in zebrafish (n = 10). (b) Typical diagram of zebrafish liver toxicity after sptA treatment (n = 10). (c, d) Liver fluorescence area and liver fluorescence analysis of the livers of sptA-treated zebrafish at 48 hpe (n = 10). (e) Heart toxicity ‘dose-mortality’ curve of sptA in zebrafish (n = 10). (f) Typical diagram of zebrafish heart toxicity after sptA treatment (n = 10). (g) Heart rate of zebrafish treated with sptA for 48 hpe (n = 10). Data shown are means ± SD, with individual values in (c, d, g). *P < 0.05, significantly different as indicated, n.s., not significant.