
|
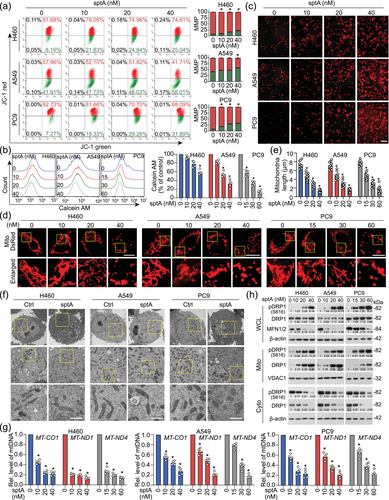
Fig. 3 sptA induces mitochondrial dysfunction in NSCLC cells. (a) Cells were treated with sptA for 24 h and stained with JC-1 to assess the ΔΨm (n = 5). (b) Cells were treated with sptA for 24 h, and mPTP opening was measured with flow cytometry using calcein AM dye (n = 5). (c) Cells were treated with sptA for 24 h. Mitochondria were stained with MitoSOX™ red FM, and mtROS accumulation was observed using confocal microscopy (n = 5). Scale bar = 50 μm. (d) Cells were transfected with Mito-DsRed for 24 h and then treated with sptA for 24 h; the mitochondria were visualised using confocal microscopy (n = 10). Scale bar = 10 μm. (e) The average mitochondrial length was determined for 10 cells in each experiment. (f) Cells were incubated with sptA (H460: 40 nM; A549: 40 nM; PC9: 60 nM) for 24 h. Ultrastructural features of mitochondria were detected using TEM (n = 5). Scale bar = 1 μm. (g) Cells were treated with sptA for 24 h. mtDNA was isolated and then analysed using qPCR (n = 5). (h) Cells were treated with sptA for 24 h. The whole cell lysate (WCL), cytosolic (Cyto) and mitochondrial (Mito) fractions were isolated and then analysed using Western blot (n = 5). Data shown are means ± SD, with individual values in (b, e, g). *P < 0.05 significantly different from control (0 nM sptA).