
|
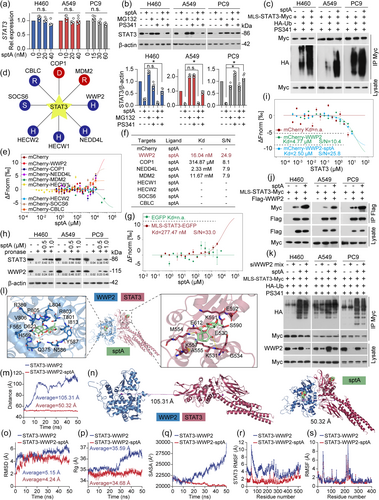
Fig. 5 sptA reduces mitoSTAT3 protein stability through WWP2-mediated ubiquitination. (a) Cells were treated with sptA for 24 h. qPCR was then performed (n = 5). (b) Cells were treated with PS341 (50 nM)/MG132 (1 μM) for 1 h and then treated with sptA (H460: 40 nM; A549: 40 nM; PC9: 60 nM) for 24 h. Western blot was performed (n = 5). (c) Cells were transfected with MLS-STAT3-Myc and HA-Ub for 6 h, treated with sptA (H460: 40 nM; A549: 40 nM; PC9: 60 nM) for 24 h and lysed. The lysates were immunoprecipitated as indicated (n = 5). (d) UbiBrowser web services analyses ubiquitin ligases that mediate STAT3 protein ubiquitination. (e–g) A549 cells were transfected with mCherry-tagged ubiquitin ligase plasmids or EGFP tagged MLS-STAT3 construct, and total protein was extracted and then incubated with sptA (n = 5). The MST assay was performed to determine the binding affinity. (h) DARTS assays were performed to assess the stabilising effects of sptA and indicated proteins (n = 5). (i) The binding affinity of purified STAT3 protein to mCherry-WWP2 in A549 cells in the presence and absence of sptA was evaluated by MST assay (n = 5). (j) Cells were co-transfected with MLS-STAT3-Myc and Flag-WWP2 for 24 h, treated with sptA (H460: 40 nM; A549: 40 nM; PC9: 60 nM) for 24 h and lysed, and then co-IP was performed (n = 5). (k) Cells were transfected with WWP2 siRNA mix (siWWP2) for 24 h. Next, the cells were co-transfected with MLS-STAT3-Myc and HA-Ub for 6 h, treated with sptA (H460: 40 nM; A549: 40 nM; PC9: 60 nM) for 24 h. The lysates were immunoprecipitated as indicated (n = 5). (l) Docking pose of sptA with STAT3 and WWP2. (m) Changes in the distance between the centres of STAT3-WWP2 with/without sptA (n = 5). (n) Changes in the average distance between the centres of STAT3-WWP2 with/without sptA (n = 5). (o) Backbone RMSD values for STAT3-WWP2 in the presence or absence of sptA during a 50 ns simulation (n = 5). (p) Changes in the Rg values for STAT3-WWP2 in the presence or absence of sptA (n = 5). (q) SASA values of STAT3-WWP2 with/without sptA (n = 5). (r) Changes in the RMSF values of STAT3 for STAT3-WWP2 with/without sptA (n = 5). (s) Changes in the RMSF values of WWP2 for STAT3-WWP2 with/without sptA (n = 5). Data shown are means ± SD, with individual values in (a, b). *P < 0.05, significantly different as indicated; n.s., not significant.