
|
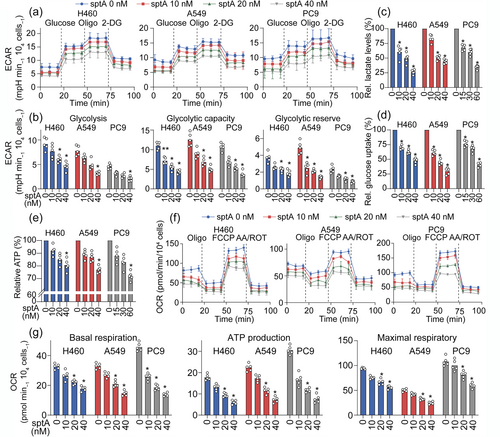
Fig. 2 sptA inhibits aerobic glycolysis and mitochondrial respiration in NSCLC cells. (a, b) Cells were treated with sptA for 24 h, after which the ECAR was detected using a Seahorse XF24. Glycolysis, glycolytic capacity and the glycolytic reserve were quantified based on the ECAR (n = 5). (c, d) Cells were treated with sptA for 24 h. Lactate production (c) and glucose uptake (d) were measured (n = 5). (e-g) Cells were treated with sptA for 24 h, after which the OCR was determined using a Seahorse XF24. Basal respiration, ATP production and maximal respiration were quantified based on the OCR (n = 5). Data shown are means ± SD, with individual values in (b-e, g). *P < 0.05, significantly different from control (0 nM sptA).