
|
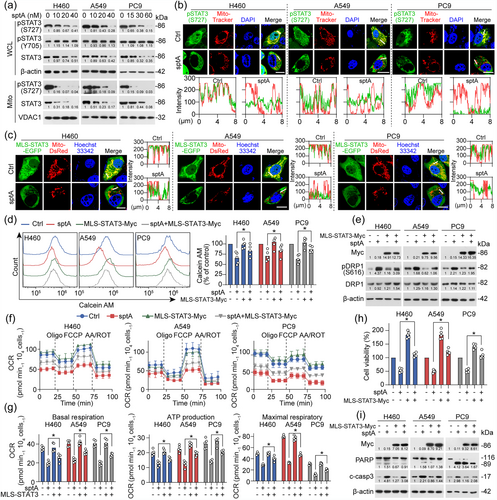
Fig. 4 sptA induces mitochondrial dysfunction in NSCLC by down-regulating mitoSTAT3. (a) Cells were treated with sptA for 24 h. The WCL and Mito fractions were isolated and then analysed by Western blot (n = 5). (b) Cells were treated with sptA (H460: 40 nM; A549: 40 nM; PC9: 60 nM) for 24 h, and mitochondria were then stained with MitoTracker Red and analysed using an immunofluorescence assay (n = 5). Scale bar = 15 μm. (c) Cells were co-transfected with MLS-STAT3-EGFP and Mito-DsRed for 24 h, treated with sptA (H460: 40 nM; A549: 40 nM; PC9: 60 nM) for 24 h and then observed using live cell imaging (n = 5). Scale bar = 15 μm. (d) Cells were transfected with MLS-STAT3 for 24 h and then treated with sptA (H460: 40 nM; A549: 40 nM; PC9: 60 nM) for 24 h. mPTP opening was measured with flow cytometry using calcein AM dye (n = 5). (e–i) Cells were transfected with MLS-STAT3 for 24 h and then treated with sptA (H460: 40 nM; A549: 40 nM; PC9: 60 nM) for 24 h (n = 5). Then, Western blot was performed (e, i). The OCR was detected with a Seahorse XF24 (f, g), and cell viability was evaluated using a CCK-8 assay (h). Data shown are means ± SD, with individual values in (d, g, h). *P < 0.05, significantly different as indicated.