
- Title
-
Nephronectin Is Required for Vascularization in Zebrafish and Sufficient to Promote Mammalian Vessel-Like Structures in Hydrogels for Tissue Engineering
- Authors
- Patra, C., Rayrikar, A., Wagh, G., Kleefeldt, F., Roshanbinfar, K., Cop, F., Nikolic, I., Schmidt, M.H.H., Acker-Palmer, A., Ergün, S., Engel, F.B.
- Source
- Full text @ J. Am. Heart Assoc.
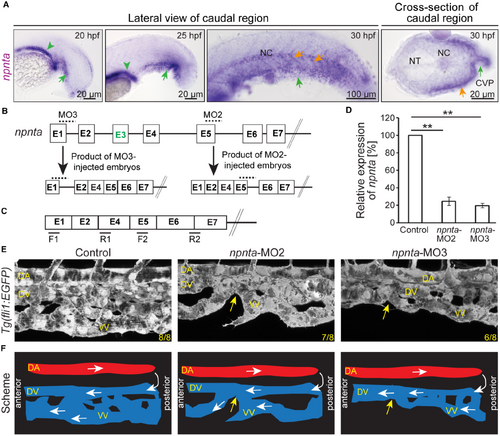
npnta knockdown disrupts ventral vein formation. A, Representative brightfield images revealing npnta expression in zebrafish embryos based on whole‐mount in situ hybridization. Green arrowheads: pronephros; green arrows: caudal vein plexus forming region; orange arrows: ventral region of the posterior somites. B and C, Scheme of the effect of MO2 and MO3. Boxes: exons. Lines: introns. Dotted lines in (B) indicate the region targeted by MO2 or MO3, and black lines in (C) indicate quantitative PCR primer positions to quantify stable matured npnta mRNA. Note, exon E3 is not used in wild types. D, Quantitative analysis of matured npnta mRNAs from control‐, MO2‐ or MO3‐injected zebrafish embryos at 30 hpf using npnta primers as indicated in (C) and 18S RNA primers (loading control; n=3, each sample is a pool of 40–50 embryos). Statistical significance was determined by 1‐way ANOVA followed by a post hoc test. Data are means±SEM. **P≤0.01. E, Lateral views of representative maximum projections of confocal images of the post‐cloaca region from 48 hpf control‐, MO2‐, or MO3‐injected Tg(fli1:EGFP) zebrafish embryos. Yellow arrows: discontinuation of VV. Numbers indicate the number of embryos with a phenotype vs the total observed embryos. F, Schematic depiction of (E). White arrows: blood flow. CVP indicates caudal vein plexus; DA, dorsal aorta; DV, dorsal vein; hpf, hours post fertilization; MO2,3 spliced blocking morpholino; NC, notochord; NT, neural tube; PCR, polymerase chain reaction; and VV, ventral vein. EXPRESSION / LABELING:
|

npnta knockdown disrupts axial vein sprouting and intersegmental vessel growth. A, Lateral views of maximum projections of confocal images of caudal vein plexus of control‐, npnta‐MO2‐ or ‐MO3‐injected Tg(fli1:EGFP) zebrafish embryos. Yellow arrowheads indicate ventral angiogenic sprouts at the axial vein. B, Quantification of angiogenic sprouts from AV at 28 hpf (n=6 embryos for each group). Mean angiogenic sprouts in the control embryos were considered as 100%. C, Maximum intensity projections of the confocal images of the lateral views of the post‐cloaca caudal region show intersegmental vessels. Yellow arrows indicate ISVs that reached the dorsal lateral anastomotic vessel, and magenta arrows indicate ISVs that are yet to reach the DLAV. D, Quantification of how many of the 8 post‐cloaca ISVs from each animal reached the DLAV at 31 hpf (n=11 embryos for each group). Pre‐cloaca ISVs were not considered for analysis. Statistical significance was determined by 1‐way ANOVA followed by a post hoc test. Data are mean±SEM. **P≤0.01; ****P≤0.0001. AV indicates axial vein; DLAV, dorsal lateral anastomotic vessel; hpf, hours post fertilization; ISV, intersegmental vessel; and MO2,3 spliced blocking morpholino. |
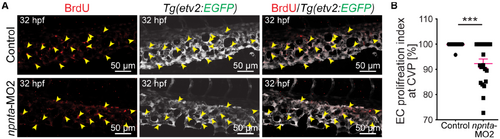
Decreased endothelial cell proliferation in the caudal vein plexus of npnta morphants. A Maximum projections of confocal images of 32 hpf whole‐mount embryos stained for 5‐bromo‐2′‐deoxyuridine (red; marking proliferating cells) and EGFP (pseudo color; labeling ECs). Arrowheads indicate 5‐bromo‐2′‐deoxyuridine+/EGFP+ cells. B, Quantitative analysis of EC proliferation at the caudal vein plexus. Graph representing the ratio of EGFP+/ethynyl‐2′‐deoxyuridine+ ECs relative to the total number of EGFP+ ECs at the CVP. A total of 24 control and 21 npnta morphants from 2 independent experiments were analyzed. The mean EC proliferative index for control embryos was considered as 100%. Statistical significance was determined by a 2‐tailed Student's t test. Data are mean±SEM. ***P≤0.001. CVP indicates caudal vein plexus; EC, endothelial cell; EGFP, enhanced green fluorescent protein; hpf, hours post fertilization; and MO2 spliced blocking morpholino. PHENOTYPE:
|
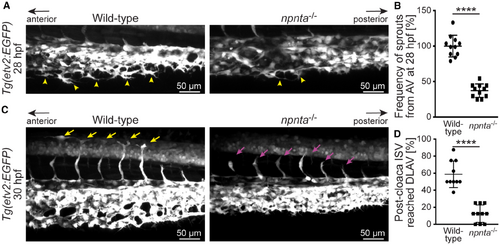
npnta mutants phenocopy the axial vessel phenotypes of npnta morphants. A, Maximum intensity projections of confocal images of the caudal vein plexus forming region. Yellow arrowheads indicate ventral angiogenic sprouts at the axial vein. B, Quantification of angiogenic sprouts from AV at 28 hpf (n=11 embryos for each group). Angiogenic sprouts in the control embryos were considered as 100%. C, Maximum intensity projections of confocal images of the posterior somite region. Yellow arrows: intersegmental vessels that reached the dorsal lateral anastomotic vessel. Magenta arrows: ISVs that are yet to reach the DLAV. D, Quantification of the ISVs out of 8 post‐cloaca ISVs that reached the DLAV at 30 hpf (n=10 embryos for each group). Statistical significance in B and D was determined by a 2‐tailed Student's t test. Data are mean±SEM. ****P≤0.0001. AV indicates axial vein; DLAV, dorsal lateral anastomotic vessel; hpf, hours post fertilization; and ISV, intersegmental vessel. |

NPNT interacts with ITGAV and ITGB3. A and B, Representative brightfield images of whole‐mount in situ hybridized embryos reveal itgav (A) or itgb3.1 (B) expression. Arrows and arrowheads indicate itgav or itgb3.1 expression in the caudal vein plexus region and posterior somites, respectively. C, Western blot analysis of total cell lysate and immune‐complexes immunoprecipitated with anti‐Flag antibody from cultured HEK‐293 cells transfected with Flag‐tagged NPNT (lane‐1), ITGAV/ITGB3 (lane‐2), and both Flag‐tagged NPNT and ITGAV/ITGB3 (lane‐3) constructs. Cell lysate and immune complexes were blotted for ITGAV and ITGB3. CVP indicates caudal vein plexus; IP, immunoprecipitate; ITGAV, integrin alpha‐V; ITGB3, integrin beta‐3 NC, notochord; NPNT, nephronectin; and NT, neural tube. EXPRESSION / LABELING:
|

itgav knockdown phenocopies npnta morphants and mutants. A, Lateral views of the maximum intensity projections of confocal images of caudal vein plexus from control‐ and itgav morpholino‐injected Tg(fli1:EGFP) zebrafish embryos. Arrowheads indicate angiogenic sprouts from the posterior axial vein and arrows point to discontinuation of ventral vein. B, Quantification of the frequency of angiogenic sprouts at CVP at 28 hpf (n=6 embryos for each group). The mean frequency of angiogenic sprouts in the control embryos was considered 100%. C, Maximum intensity projections of the confocal images of the caudal region show ISVs from the dorsal artery. D, Quantification of 8 post‐cloaca ISVs from each animal reached the dorsal lateral anastomotic vessel at 31 hpf (n=12 embryos for each group). E, Ventral views of 3‐dimensional projections of confocal images of the DV from control‐, MO2‐, MO3‐, or itgav morpholino‐injected Tg(fli1:EGFP) zebrafish embryos. Yellow lines: the maximum thickness of the DV from the ventral view. F, Quantification of the thickness of the DV at 48 hpf from ventral view (n=6 embryos for each group). The mean value of the control was considered 100% in each case. Statistical significance in B and D was determined by a 2‐tailed Student's t test and in F by 1‐way ANOVA followed by a post hoc test. Data are mean±SEM. **P≤0.01; ***P≤0.001. AV indicates axial vein; CVP, caudal vein plexus; DLAV, dorsal lateral anastomotic vessel; DV, dorsal vein; hpf, hours post fertilization; ISV, intersegmental vessel; and MO2,3 spliced blocking morpholino. PHENOTYPE:
|

Adult npnta mutants exhibit decreased vessel pruning during caudal fin regeneration. A, Representative overlays of bright‐field and epifluorescence images as well as epifluorescence images of individual caudal fins of a wild‐type and npnta mutant in an Tg(etv2:EGFP) background at 5 days post amputation revealing decreased vessel maturation (magenta; endothelial cell membrane) during caudal fin regeneration. Double‐sided yellow arrows: length of neovascular plexus. Double‐sided red arrows: length of matured neovessels. Scale bars: 200 μm. B, Quantitative analysis of the length of regenerated fins and the length (μm) of regenerated blood vessels. C, Quantification of the length of the matured blood vessels at the proximal ends of the regenerated fins. Statistical significance was determined by a 2‐tailed Student's t test. Data are mean±SEM. ns: P>0.05, and **P≤0.01. PHENOTYPE:
|

Nephronectin promotes HUVEC migration, tube formation, and stabilization in vitro. A, Cell migration assay: representative brightfield images of wound assays 1 and 6 hours after scratching. Cells were cultured on gelatin‐ (control) or mr‐NPNT‐coated 24‐well cell culture plates. B, Quantitative analysis of cell migration (n=4). The mean value of the control was considered 100% in each case. C, Tube formation assay: representative brightfield images of HUVECs cultured on Matrigel with BSA (10 μg/mL, control) or mr‐NPNT (10 μg/mL) at 4 and 22 hours after seeding. D–F, Quantitative analysis of tube branching (D), and tube stability (E, F) (n=4). Mean value of the control was considered 100% in each case. Statistical significance was determined by a 2‐tailed Student's t test. Data are mean±SEM. ns: P>0.05. *P≤0.05. HUVEC indicates human umbilical vascular endothelial cell; and mr‐NPNT, recombinant mouse nephronectin. |

Nephronectin promotes intercapillary network formation and smooth muscle cell recruitment. A, Phase‐contrast images of aortic rings at 7 days in culture. Aortic rings were embedded in collagen‐I solution and cultured in supplemented Opti‐MEM culture medium with or without VEGF or/and recombinant mouse NPNT in 96‐well cell culture plates. B–D, Quantitative analysis of maximum distance covered by angiogenic sprouts (n=7) (B), periaortic vascular capillary branch points density (n=4) (C), and the maximum diameter of the periaortic vessels (n=9) (D). E and F, Representative examples of the appearance of pericytes/smooth muscle cells (α‐smooth muscle Actin‐positive, arrows) surrounding vascular sprouts (E) and quantitative analysis (F). Statistical significance in (B) was determined by 1‐way ANOVA followed by a pos thoc test and in (C–F) by a 2‐tailed Student's t test. Data are mean±SEM. ns: P ≥ 0.05; *P≤0.05; ***P≤0.001. α‐SMA indicates α‐smooth muscle actin; DAPI, 4′,6‐diamidino‐2‐phenylindole; NPNT, nephronectin; and VEGF, vascular endothelial growth factor. |

mr‐NPNT enhances vessel formation in hydrogels. A, Examples of projections of confocal images of HUVECs (passage number 2, P2) cultured in collagen‐I‐based hydrogels stained for endothelial specific marker CD31 and DNA by 4′,6‐diamidino‐2‐phenylindole. Yellow dots: examples of junctions. Green asterisks: examples of meshes. B, Schematic of a vascular network indicating measured parameters. C, Quantitative analysis of (A) (n=3) regarding vasculature complexity based on branching index, number of meshes, and total length (segments + branches). Statistical significance was determined by a 2‐tailed Student's t test. Data are mean±SEM. ***P≤0.001. DAPI indicates 4′,6‐diamidino‐2‐phenylindole; HUVEC, human umbilical vascular endothelial cell; mr‐NPNT, recombinant mouse nephronectin. |
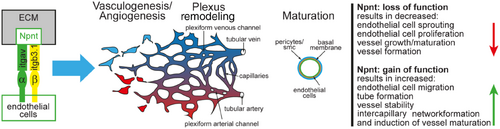
Summary of the role of nephronectin in angiogenesis. ECM indicates extracellular matrix; and Smc, smooth muscle cells. |