
|
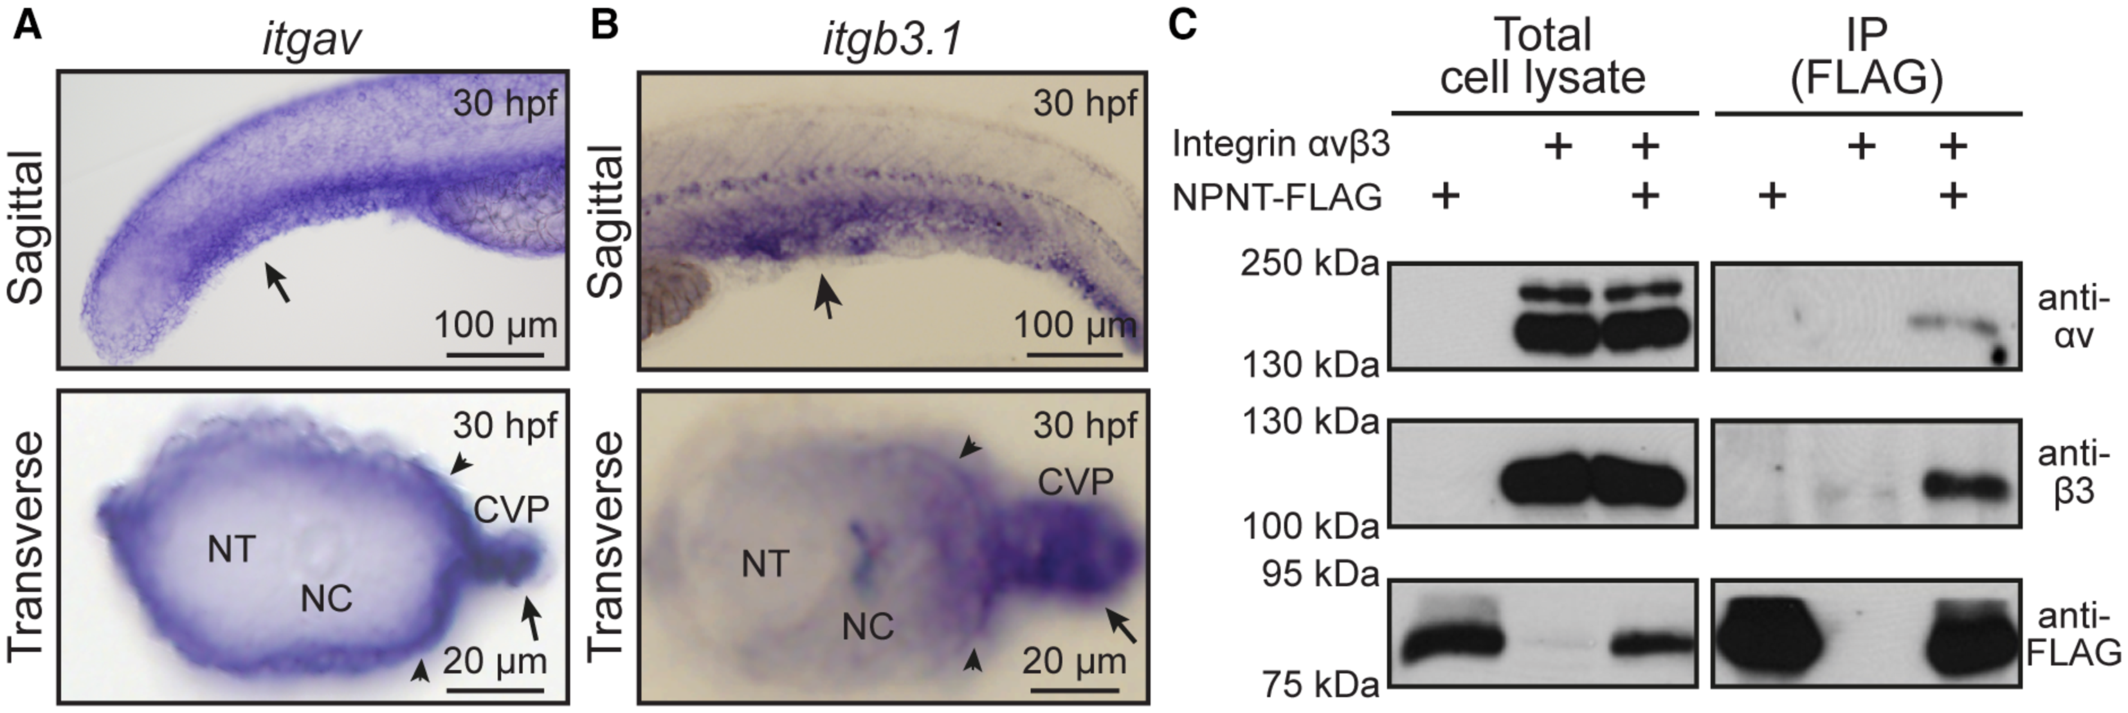
Fig. 5 NPNT interacts with ITGAV and ITGB3. A and B, Representative brightfield images of whole‐mount in situ hybridized embryos reveal itgav (A) or itgb3.1 (B) expression. Arrows and arrowheads indicate itgav or itgb3.1 expression in the caudal vein plexus region and posterior somites, respectively. C, Western blot analysis of total cell lysate and immune‐complexes immunoprecipitated with anti‐Flag antibody from cultured HEK‐293 cells transfected with Flag‐tagged NPNT (lane‐1), ITGAV/ITGB3 (lane‐2), and both Flag‐tagged NPNT and ITGAV/ITGB3 (lane‐3) constructs. Cell lysate and immune complexes were blotted for ITGAV and ITGB3. CVP indicates caudal vein plexus; IP, immunoprecipitate; ITGAV, integrin alpha‐V; ITGB3, integrin beta‐3 NC, notochord; NPNT, nephronectin; and NT, neural tube.