
Fig. 1
- ID
- ZDB-IMAGE-250311-75
- Genes
- Publication
- Patra et al., 2025 - Nephronectin Is Required for Vascularization in Zebrafish and Sufficient to Promote Mammalian Vessel-Like Structures in Hydrogels for Tissue Engineering
- All Figures
- Figures for Patra et al., 2025
|
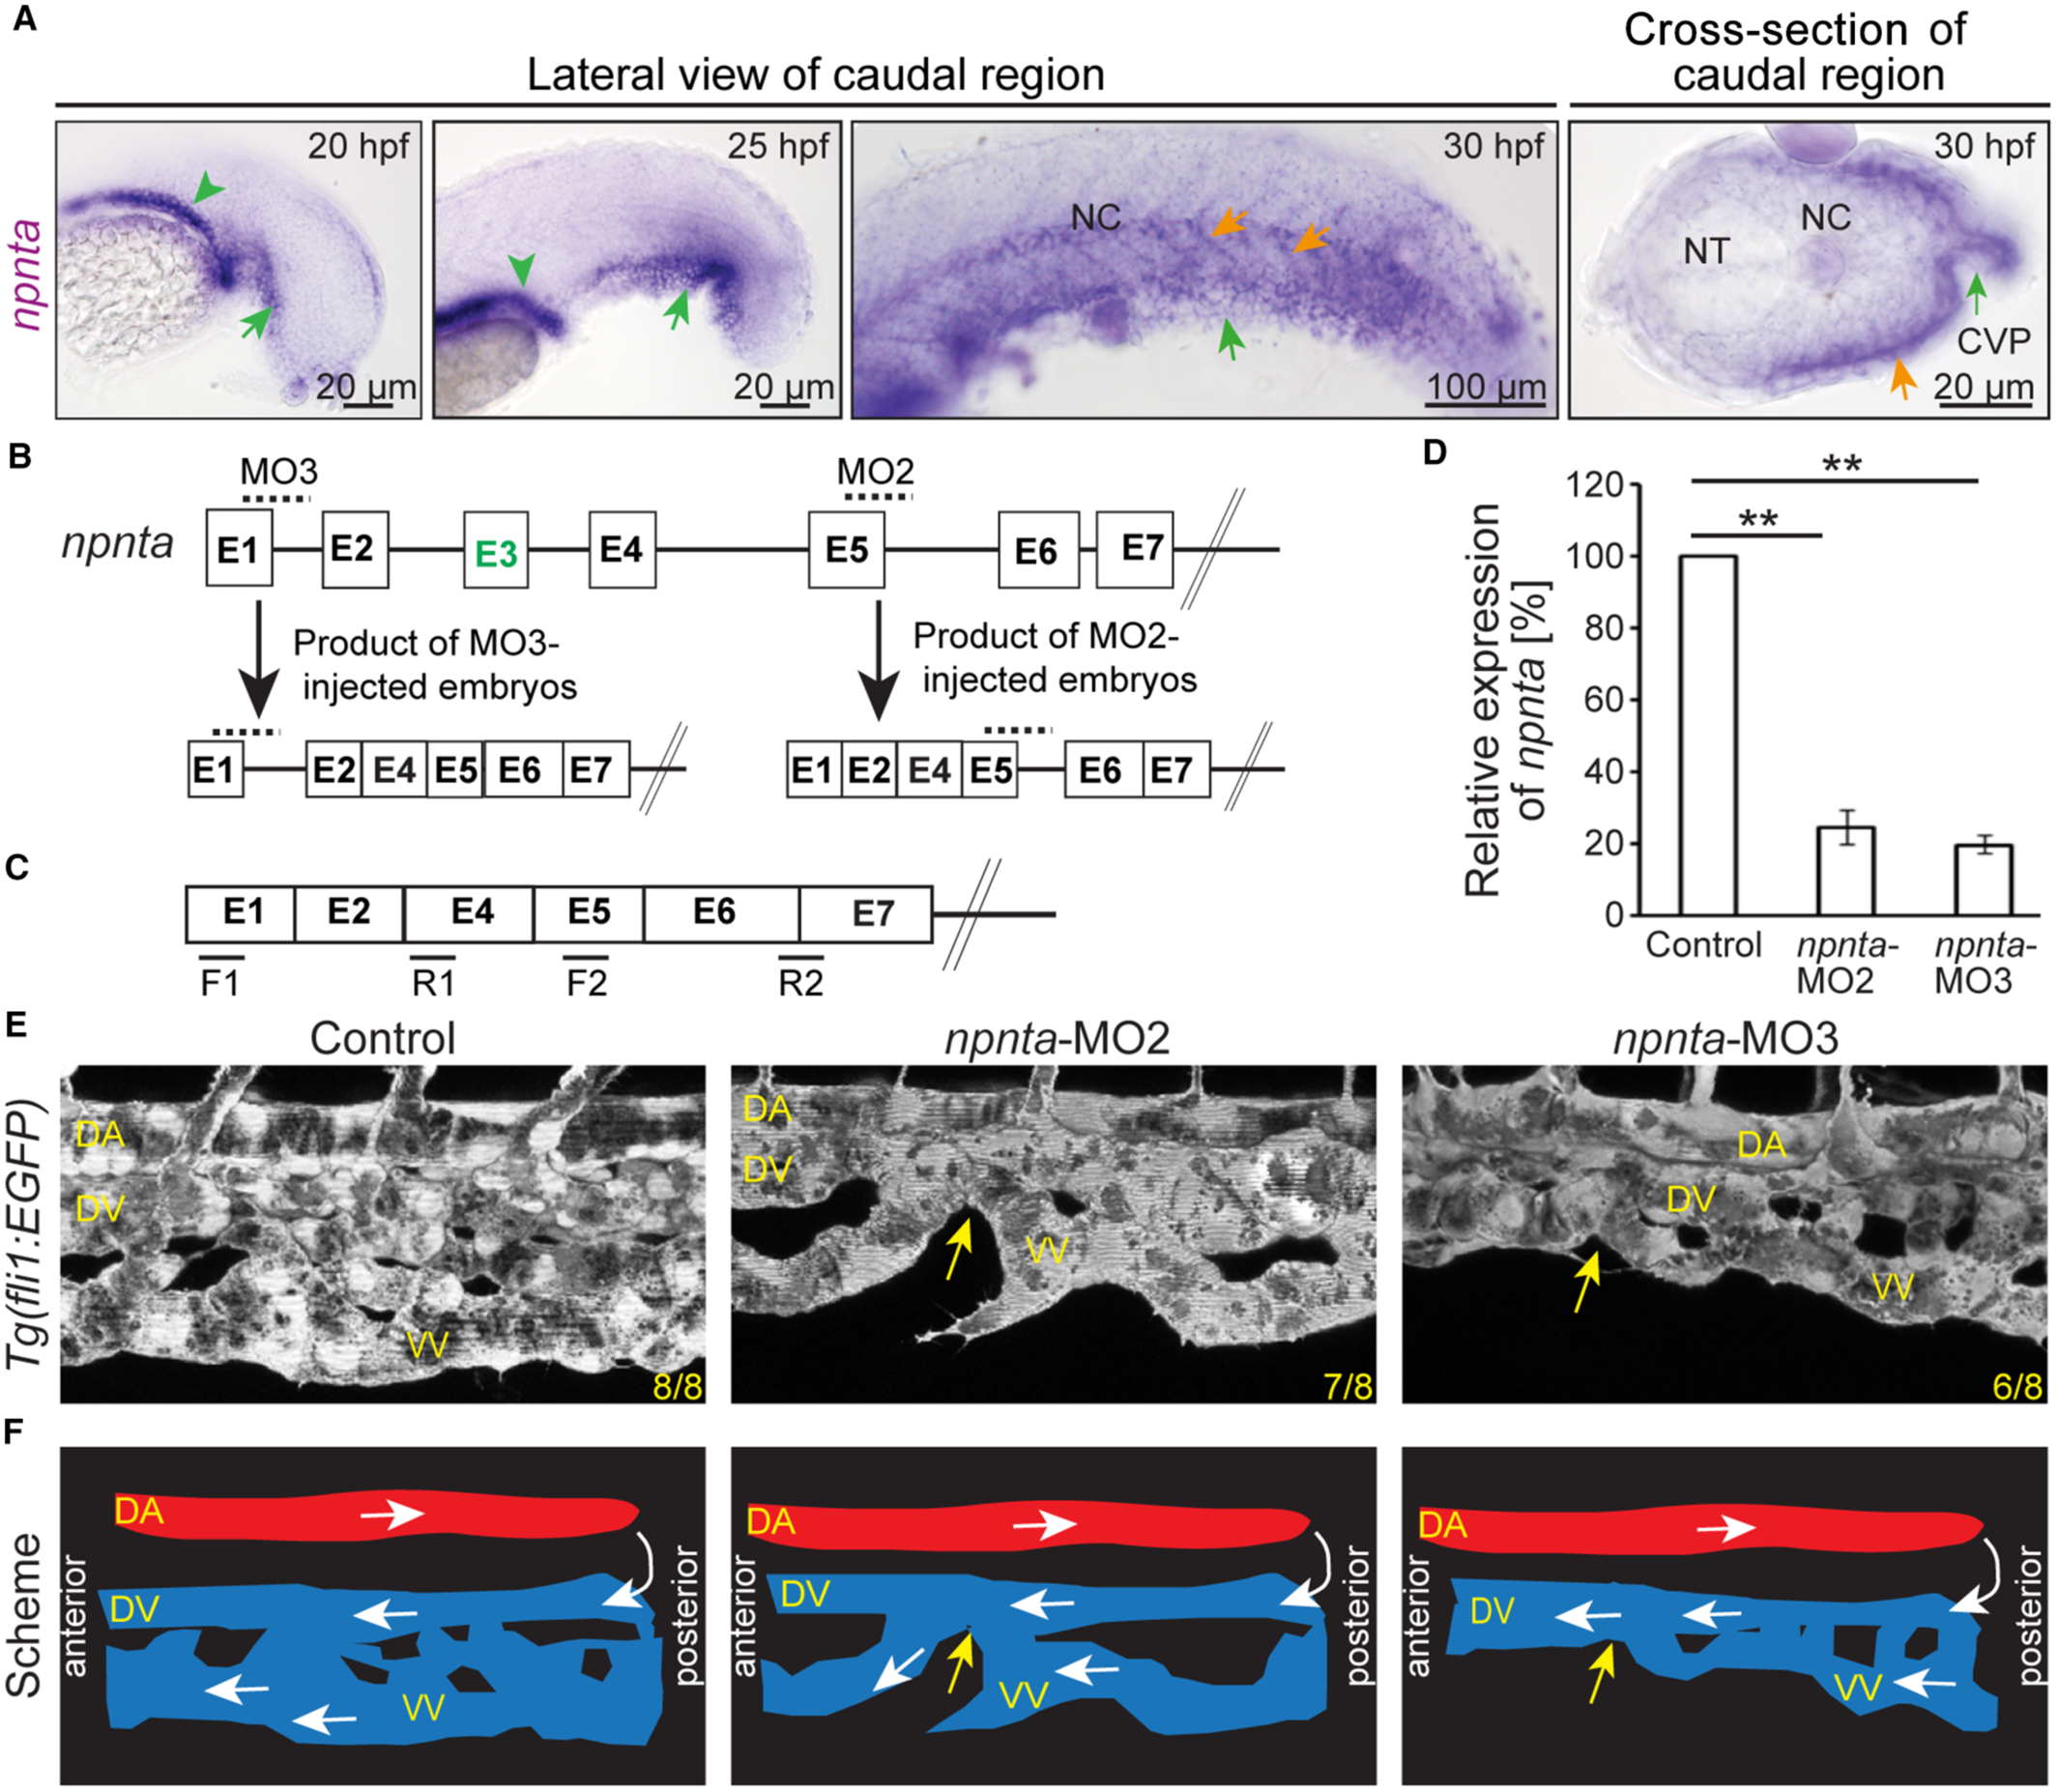
Fig. 1 npnta knockdown disrupts ventral vein formation. A, Representative brightfield images revealing npnta expression in zebrafish embryos based on whole‐mount in situ hybridization. Green arrowheads: pronephros; green arrows: caudal vein plexus forming region; orange arrows: ventral region of the posterior somites. B and C, Scheme of the effect of MO2 and MO3. Boxes: exons. Lines: introns. Dotted lines in (B) indicate the region targeted by MO2 or MO3, and black lines in (C) indicate quantitative PCR primer positions to quantify stable matured npnta mRNA. Note, exon E3 is not used in wild types. D, Quantitative analysis of matured npnta mRNAs from control‐, MO2‐ or MO3‐injected zebrafish embryos at 30 hpf using npnta primers as indicated in (C) and 18S RNA primers (loading control; n=3, each sample is a pool of 40–50 embryos). Statistical significance was determined by 1‐way ANOVA followed by a post hoc test. Data are means±SEM. **P≤0.01. E, Lateral views of representative maximum projections of confocal images of the post‐cloaca region from 48 hpf control‐, MO2‐, or MO3‐injected Tg(fli1:EGFP) zebrafish embryos. Yellow arrows: discontinuation of VV. Numbers indicate the number of embryos with a phenotype vs the total observed embryos. F, Schematic depiction of (E). White arrows: blood flow. CVP indicates caudal vein plexus; DA, dorsal aorta; DV, dorsal vein; hpf, hours post fertilization; MO2,3 spliced blocking morpholino; NC, notochord; NT, neural tube; PCR, polymerase chain reaction; and VV, ventral vein.