
Fig. 6
- ID
- ZDB-IMAGE-250311-80
- Publication
- Patra et al., 2025 - Nephronectin Is Required for Vascularization in Zebrafish and Sufficient to Promote Mammalian Vessel-Like Structures in Hydrogels for Tissue Engineering
- All Figures
- Figures for Patra et al., 2025
|
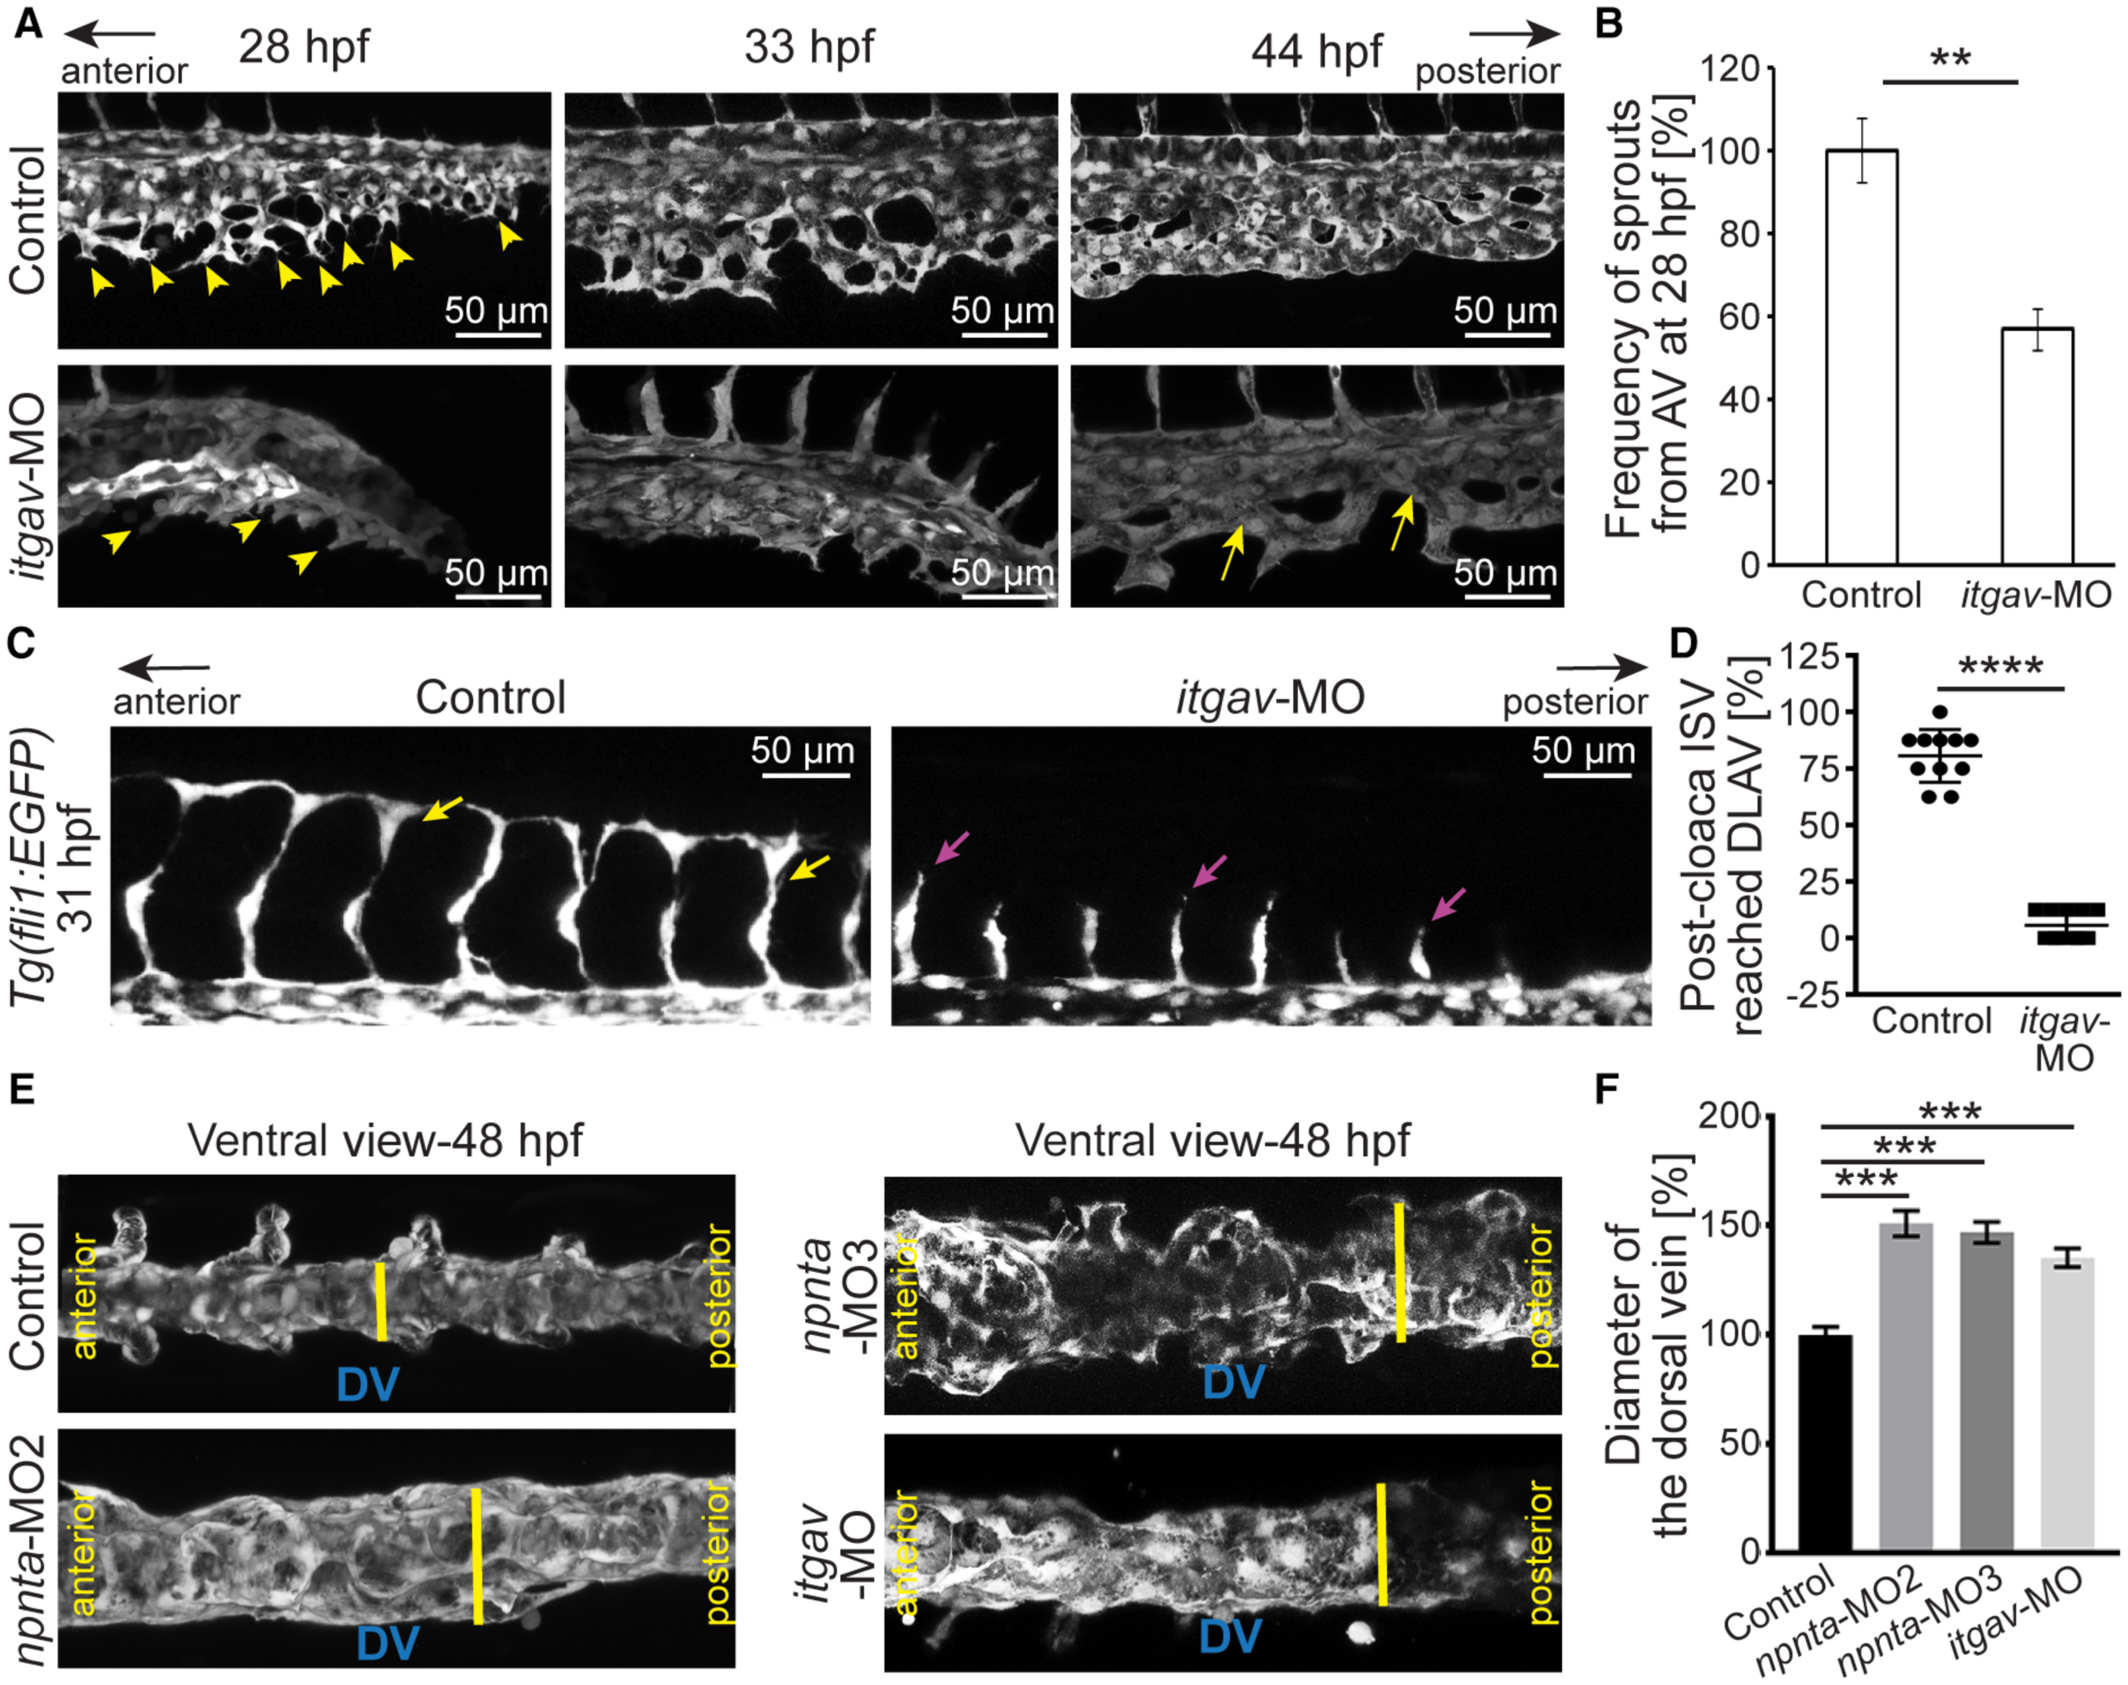
Fig. 6 itgav knockdown phenocopies npnta morphants and mutants. A, Lateral views of the maximum intensity projections of confocal images of caudal vein plexus from control‐ and itgav morpholino‐injected Tg(fli1:EGFP) zebrafish embryos. Arrowheads indicate angiogenic sprouts from the posterior axial vein and arrows point to discontinuation of ventral vein. B, Quantification of the frequency of angiogenic sprouts at CVP at 28 hpf (n=6 embryos for each group). The mean frequency of angiogenic sprouts in the control embryos was considered 100%. C, Maximum intensity projections of the confocal images of the caudal region show ISVs from the dorsal artery. D, Quantification of 8 post‐cloaca ISVs from each animal reached the dorsal lateral anastomotic vessel at 31 hpf (n=12 embryos for each group). E, Ventral views of 3‐dimensional projections of confocal images of the DV from control‐, MO2‐, MO3‐, or itgav morpholino‐injected Tg(fli1:EGFP) zebrafish embryos. Yellow lines: the maximum thickness of the DV from the ventral view. F, Quantification of the thickness of the DV at 48 hpf from ventral view (n=6 embryos for each group). The mean value of the control was considered 100% in each case. Statistical significance in B and D was determined by a 2‐tailed Student's t test and in F by 1‐way ANOVA followed by a post hoc test. Data are mean±SEM. **P≤0.01; ***P≤0.001. AV indicates axial vein; CVP, caudal vein plexus; DLAV, dorsal lateral anastomotic vessel; DV, dorsal vein; hpf, hours post fertilization; ISV, intersegmental vessel; and MO2,3 spliced blocking morpholino.