
Fig. 2
- ID
- ZDB-IMAGE-250311-76
- Publication
- Patra et al., 2025 - Nephronectin Is Required for Vascularization in Zebrafish and Sufficient to Promote Mammalian Vessel-Like Structures in Hydrogels for Tissue Engineering
- All Figures
- Figures for Patra et al., 2025
|
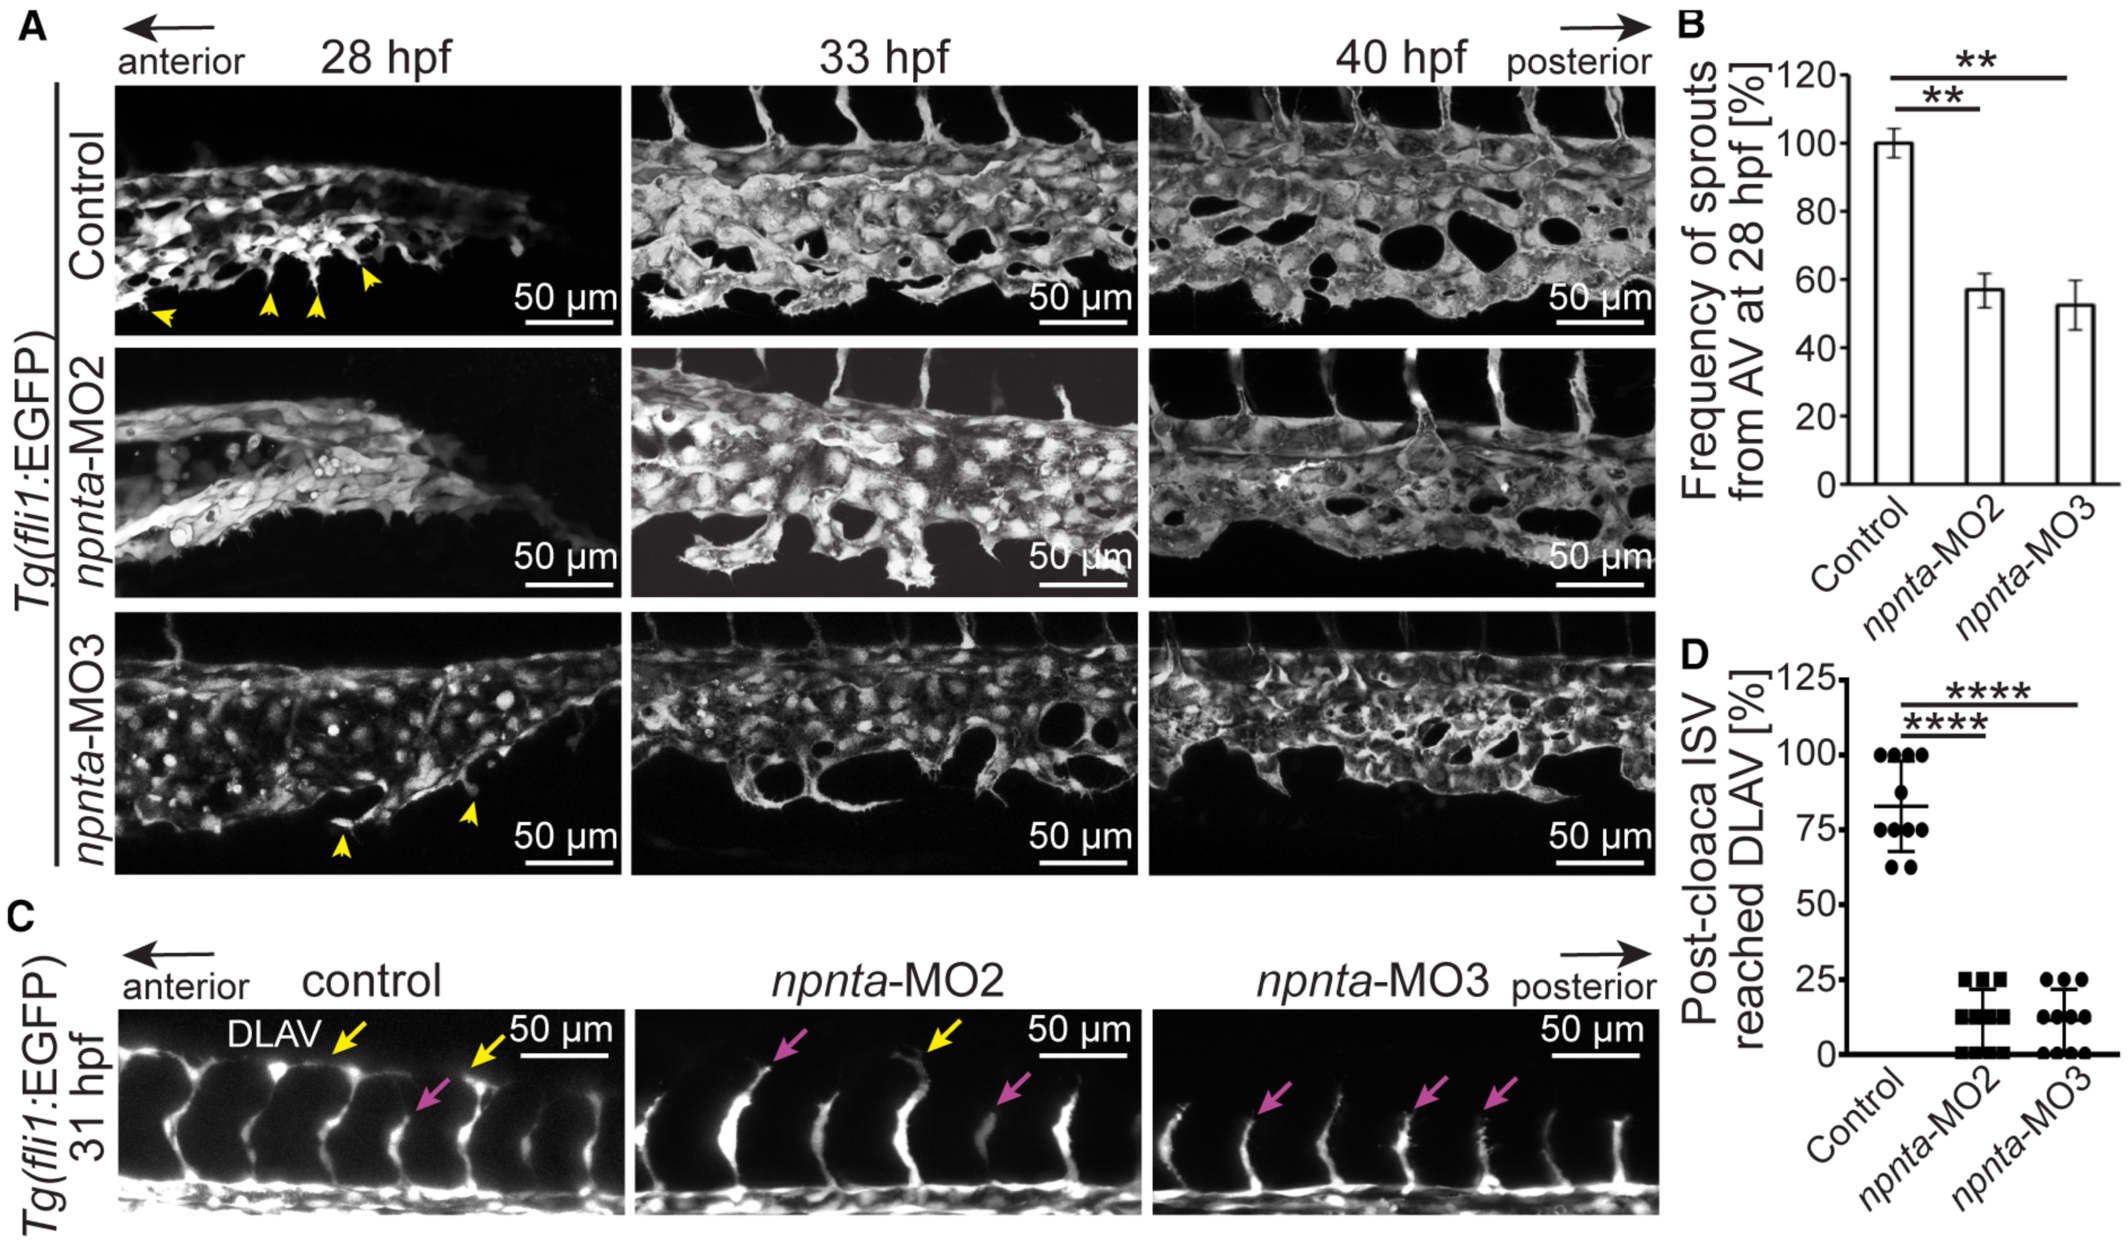
Fig. 2 npnta knockdown disrupts axial vein sprouting and intersegmental vessel growth. A, Lateral views of maximum projections of confocal images of caudal vein plexus of control‐, npnta‐MO2‐ or ‐MO3‐injected Tg(fli1:EGFP) zebrafish embryos. Yellow arrowheads indicate ventral angiogenic sprouts at the axial vein. B, Quantification of angiogenic sprouts from AV at 28 hpf (n=6 embryos for each group). Mean angiogenic sprouts in the control embryos were considered as 100%. C, Maximum intensity projections of the confocal images of the lateral views of the post‐cloaca caudal region show intersegmental vessels. Yellow arrows indicate ISVs that reached the dorsal lateral anastomotic vessel, and magenta arrows indicate ISVs that are yet to reach the DLAV. D, Quantification of how many of the 8 post‐cloaca ISVs from each animal reached the DLAV at 31 hpf (n=11 embryos for each group). Pre‐cloaca ISVs were not considered for analysis. Statistical significance was determined by 1‐way ANOVA followed by a post hoc test. Data are mean±SEM. **P≤0.01; ****P≤0.0001. AV indicates axial vein; DLAV, dorsal lateral anastomotic vessel; hpf, hours post fertilization; ISV, intersegmental vessel; and MO2,3 spliced blocking morpholino.