
- Title
-
Brain penetration of peripheral extracellular vesicles from Alzheimer's patients and induction of microglia activation
- Authors
- Counil, H., Silva, R.O., Rabanel, J.M., Zaouter, C., Haddad, M., Ben Khedher, M.R., Brambilla, D., Fülöp, T., Patten, S.A., Ramassamy, C.
- Source
- Full text @ J Extracell Biol
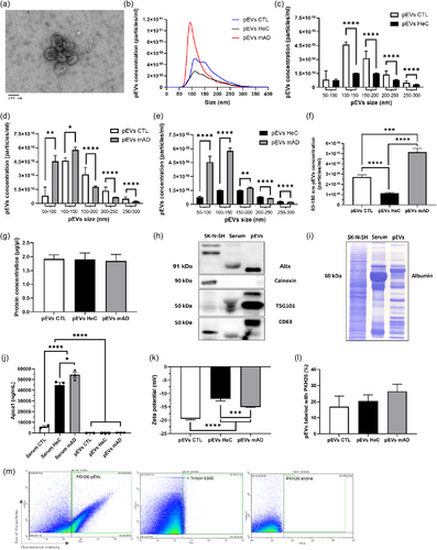
Characterization of pEVs isolated from human sera. (a) TEM images. (b)–(f) NTA analysis and concentrations of pEVs stratified by size range in CTL (n = 4), HeC and mAD patients (n = 17 per group). Differences were analysed by the Mann–Whitney test. (g) Protein concentrations in pEVs were compared by ordinary one-way ANOVA followed by Tukey's multiple comparisons test. (h) Immunodetection of EVs markers Alix, TG101, CD63. Calnexin was used as a negative control. (i) Total proteins remaining on PVDF membrane after the transfer revealed by Coomassie blue. (j) Levels of ApoA1 in the sera and pEVs were compared by ELISA and compared by ordinary one-way ANOVA followed by Tukey's multiple comparisons test. (k) Zeta potential was determined by DLS and compared by ordinary one-way ANOVA followed by Tukey's multiple comparisons test. (l) Comparison of the percentage of pEVs labelled with the fluorescent dye PKH-26, by unpaired t-test. (m) Nanoscale flow cytometry analysis of the pEVs labelled with the fluorescent dye PKH-26, with and without the addition of 0.2% Triton X100, and analysis of free PKH26 without pEVs. All samples were diluted at 1:1000. Prior statistical analysis, the normality of each data set was evaluated. Data are expressed as mean ± SEM with *p ≤ 0.5; **p ≤ 0.05; ***p ≤ 0.005; ****p ≤ 0.0005. pEVs, peripheral EVs; TEM, transmission electron microscopy. |
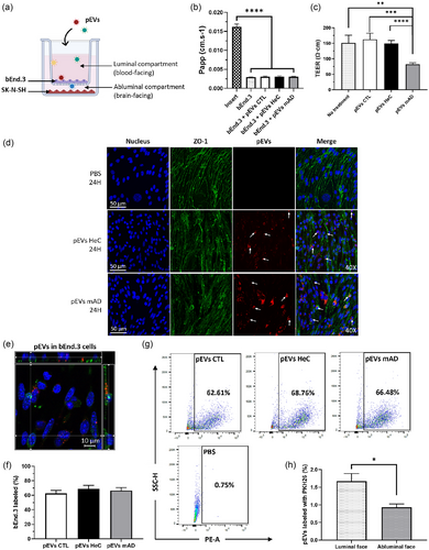
Passage of pEVs through bEnd.3 endothelial cells in the presence of SK-N-SH neuronal cells. (a) bEnd.3 cells were cultured on a Transwell for 10 days with SK-N-SH cells seeded at the bottom, then 1 1010 pEVs/mL were added at the luminal side for 24 h. (b) Papp of bEnd.3 cells untreated and treated with pEVs were compared by ordinary one-way ANOVA. (c) Measurement of the TEER after 24 h of treatment with either PBS or pEVs. Groups were compared by the Kruskal–Wallis test. (d) Confocal imaging of pEVs (in red, indicated by arrows) internalized by bEnd.3 cells (nucleus in blue, ZO-1 in green). (e) Internalization of PKH-pEVs (in red, indicated by arrows) by bEnd.3 cells (nucleus in blue, ZO-1 in green) with their nucleus labelled (in blue) (40×). (f)–(g) Percentage of bEnd.3 cells internalizing the PKH-pEVs from different groups were quantified by flow cytometry and compared by ordinary one-way ANOVA. (h) The percentage of PKH-pEVs in the luminal and abluminal media was assessed by nanoscale flow cytometry and compared by the Wilcoxon matched-pairs signed rank test. Prior statistical analysis, the normality of each data set was evaluated. Data are expressed in mean ± SEM with *p ≤ 0.5; **p ≤ 0.05; ***p ≤ 0.005; ****p ≤ 0.0005 with n ≥ 6 per group. pEVs, peripheral EVs. |
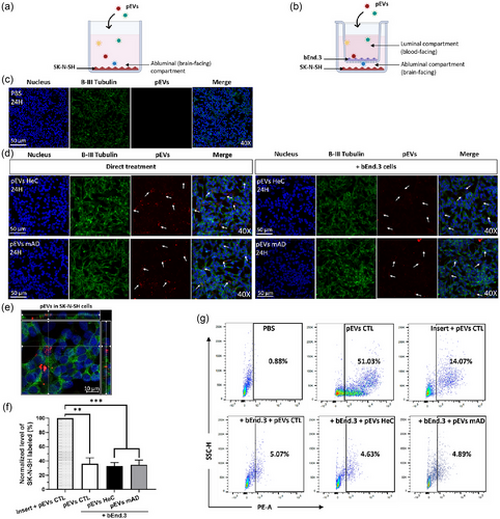
Internalization of pEVs by SK-N-SH neuronal cells after their passage through bEnd.3 endothelial cells in vitro. (a) SK-N-SH cells were cultured at the bottom without or (b) with bEnd.3 cells seeded on a Transwell for 10 days, then 1 1010 pEVs/mL were added at the luminal side for 24 h. (c) Incubation with PBS for 24 h without PKH-pEVs. (d) Confocal imaging of PKH-pEVs (in red, indicated by arrows) internalized by SK-N-SH cells (nucleus in blue, β-III Tubulin in green) following a direct treatment or in the presence of bEnd.3 cells in the Transwell device. (e) Internalization of PKH-pEVs (in red, indicated by arrows) by SK-N-SH cells (40×). (f)–(g) Percentage of SK-N-SH cells internalizing PKH-pEVs quantified by flow cytometry and compared by ordinary one-way ANOVA, Tukey's multiple comparisons test. Prior statistical analysis, the normality of each data set was evaluated. Data are expressed in mean ± SEM with *p ≤ 0.5; **p ≤ 0.05; ***p ≤ 0.005; ****p ≤ 0.0005 with n ≥ 6 per group. pEVs, peripheral EVs. |
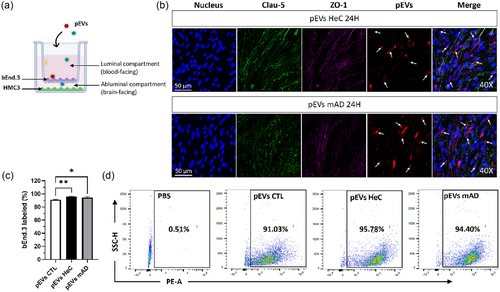
Passage of pEVs through bEnd.3 endothelial cells in the presence of HMC3 microglial cells. (a) bEnd.3 cells were cultured on a Transwell for 10 days with HMC3 cells seeded at the bottom, and 1 1010 pEVs/mL were added for 24 h. (b) Uptake of PKH-pEVs (in red, indicated by arrows) by bEnd.3 cells (nuclei in blue, Clau-5 in green, ZO-1 in purple). (c)–(d) Percentage of bEnd.3 cells internalizing PKH-pEVs were quantified by flow cytometry and compared by ordinary one-way ANOVA. Prior statistical analysis, the normality of each data set was evaluated. Data are expressed in mean ± SEM with *p ≤ 0.5; **p ≤ 0.05; ****p ≤ 0.0005 with n ≥ 6 per group. pEVs, peripheral EVs. |
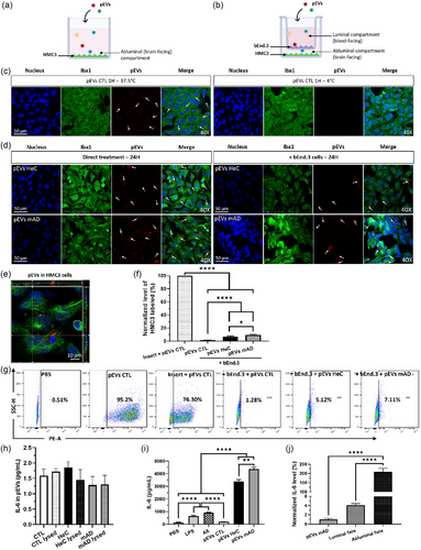
Internalization of pEVs by HMC3 microglial cells after their passage through bEnd.3 endothelial cells. (a) HMC3 cells were cultured at the bottom without or (b) with bEnd.3 cells seeded on a Transwell for 10 days, then 1 1010 pEVs/mL were added at the luminal side for 24 h. (c) Internalization of PKH-pEVs (in red, indicated by arrows) by HMC3 cells (nuclei in blue, Iba1 in green) at 4°C and 37.5°C after 1-h and (d) 24 h incubation with or without bEnd.3 cells on the Transwell device. (e) Internalization of PKH-pEVs (in red) by microglial cells (nucleus in blue, Iba1 in green) confirmed by a z-axis plan (40×). (f) Percentages of HMC3 cells internalizing PKH-pEVs were quantified by flow cytometry and normalized according to the incubation of microglial cells with an insert and pEVs CTL in the luminal compartment. Results were compared by ordinary one-way ANOVA and Tukey's multiple comparisons test. (g) Percentages of HMC3 cells internalizing PKH-pEVs were quantified by flow cytometry. (h) Levels of IL-6 on pEV samples by ELISA and comparison by ordinary one-way ANOVA, Tukey's multiple comparisons test. (i) Quantification of IL-6 released by HMC3 cells in the media following 24 h of treatment with either PBS, LPS, Aβ or pEVs. Comparison by ordinary one-way ANOVA, Tukey's multiple comparisons test. (j) Levels of IL-6 released by HMC3 cells in the presence of bEnd.3 cells and were normalized according to the amount transported by pEVs mAD. IL-6 levels were quantified into both compartments of the Transwell device and compared by ordinary one-way ANOVA, Tukey's multiple comparisons test. Prior statistical analysis, the normality of each data set was evaluated. Data are expressed in mean ± SEM with *p ≤ 0.5; **p ≤ 0.05; ****p ≤ 0.0005 with n ≥ 6 per group. |

In vivo biodistribution of pEVs in Tg(flk1:EGFP) zebrafish larvae at 2 dpf and 3 dpf. (a) 4.5 nL of PBS or pEVs from either HeC or mAD patients (1 1010 pEVs/mL) were microinjected into the blood circulation of 2 days post-fertilization larvae, and the biodistribution was followed 1 and 24 hpi by in vivo confocal microscopy. (b) Live confocal images (maximum projection) at 1 and 24 hpi of zebrafish larva bodies (10×), with pEVs in red and blood vessels in green and (c) magnification of the head and the trunk, with red pEVs are indicated by arrows. (d) Three-dimensional reconstruction on Imaris software of the trunk and (e) the head of a zebrafish larvae 1 hpi of PKH-pEVs. Endothelial cells are in green, PKH-pEVs from HeC patients are in red, and colocalization areas are in white. (f) Quantification of the head-to-total body fluorescence intensity ratio was performed using Zen 2.6 software, and comparisons were made using ordinary one-way ANOVA followed by Tukey's multiple comparisons test. Prior statistical analysis, the normality of each data set was evaluated. Data are expressed in mean ± SEM **p ≤ 0.05; ***p ≤ 0.005 with n = 7 per group. |
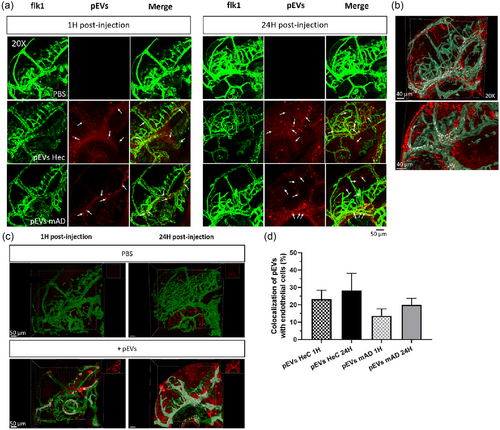
Internalization of pEVs by endothelial cells in Tg(flk1:EGFP) zebrafish larvae at 2 and 3 dpf and brain homing. 4.5 nL of PBS or pEVs from either HeC or mAD patients (1 1010 pEVs/mL) were microinjected into the blood circulation of 2 days post-fertilization larvae, and the biodistribution was followed 1 and 24 hpi by in vivo confocal microscopy. (a) Live confocal images (maximum projection) at 1 and 24 hpi of the head of zebrafish larvae (20×) after injection of either PBS or pEVs (in red, indicated by arrows). Endothelial cells are in green. (b)–(c) Three-dimensional reconstruction on Imaris software of the head of the zebrafish in control (CTL) condition or 1 and 24 hpi of PKH-pEVs. Endothelial cells are in green, PKH-pEVs from mAD patients are in red, and colocalization areas are in white. (d) The percentage of internalization of PKH-pEVs by endothelial cells was quantified by using Imaris software and analysed by ordinary one-way ANOVA followed by Tukey's multiple comparisons test. Prior statistical analysis, the normality of each data set was evaluated with n = 7 per group. |

Brain homing of pEVs and their internalization by neuronal cells in the Tg(huc:EGFP) zebrafish. (a) Live confocal images (maximum projection) at 1 hpi and 24 hpi of the head of Tg(huc:EGFP) larvae (20× and 40×) after injection of 4.5 nL of PBS or pEVs (1 1010 pEVs/mL) from either HeC or mAD patients (red, indicated by arrows). Neurons are in green and the nucleus in blue. (b) Three-dimensional reconstruction on Imaris software of the head of the zebrafish 1 and 24 hpi of PKH-pEVs from HeC (20×) and mAD (40×) patients. Neuronal cells are in green, PKH-pEVs are in red, and colocalization areas are in white. (c) The percentage of neurons engulfing PKH-pEVs was quantified by Zen 2.6 software and compared by ordinary one-way ANOVA followed by Tukey's multiple comparisons test. |
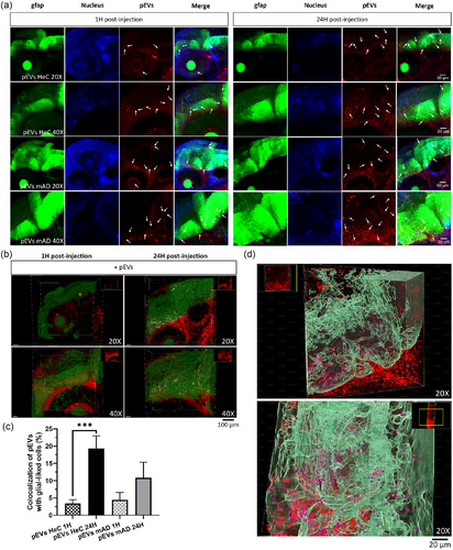
Brain homing of pEVs and their internalization by glial-like cells in the Tg(gfap:EGFP) zebrafish. (a) Live confocal images (maximum projection) at 1 and 24 hpi of the head of Tg(gfap1:EGFP) larvae (20× and 40×), with pEVs in red (indicated by arrows) and glial-like cells in green. (b) Three-dimensional reconstruction on Imaris software of the head of the zebrafish 1 and 24 hpi of PKH-pEVs from HeC (20×) and mAD (40×) patients. Glial-like cells are in green, PKH-pEVs are in red, and colocalization areas are in white. (c) The percentage of glial-like cells capturing PKH-pEVs was quantified by Zen 2.6 software and compared by ordinary one-way ANOVA followed by Tukey's multiple comparisons test. (d) Three-dimensional reconstruction on Imaris software of PKH-pEVs diffusion into the brain and their internalization by glial-like cells 24 hpi. Prior statistical analysis, the normality of each data set was evaluated. Data are expressed in mean ± SEM **p ≤ 0.05; ***p ≤ 0.005 with n = 7 per group. |