
Fig. 1
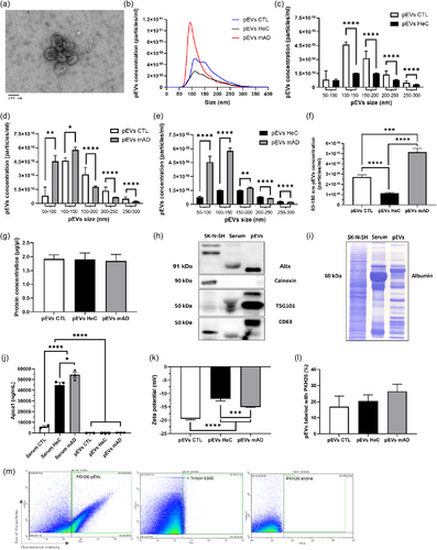
Characterization of pEVs isolated from human sera. (a) TEM images. (b)–(f) NTA analysis and concentrations of pEVs stratified by size range in CTL (n = 4), HeC and mAD patients (n = 17 per group). Differences were analysed by the Mann–Whitney test. (g) Protein concentrations in pEVs were compared by ordinary one-way ANOVA followed by Tukey's multiple comparisons test. (h) Immunodetection of EVs markers Alix, TG101, CD63. Calnexin was used as a negative control. (i) Total proteins remaining on PVDF membrane after the transfer revealed by Coomassie blue. (j) Levels of ApoA1 in the sera and pEVs were compared by ELISA and compared by ordinary one-way ANOVA followed by Tukey's multiple comparisons test. (k) Zeta potential was determined by DLS and compared by ordinary one-way ANOVA followed by Tukey's multiple comparisons test. (l) Comparison of the percentage of pEVs labelled with the fluorescent dye PKH-26, by unpaired t-test. (m) Nanoscale flow cytometry analysis of the pEVs labelled with the fluorescent dye PKH-26, with and without the addition of 0.2% Triton X100, and analysis of free PKH26 without pEVs. All samples were diluted at 1:1000. Prior statistical analysis, the normality of each data set was evaluated. Data are expressed as mean ± SEM with *p ≤ 0.5; **p ≤ 0.05; ***p ≤ 0.005; ****p ≤ 0.0005. pEVs, peripheral EVs; TEM, transmission electron microscopy. |