
|
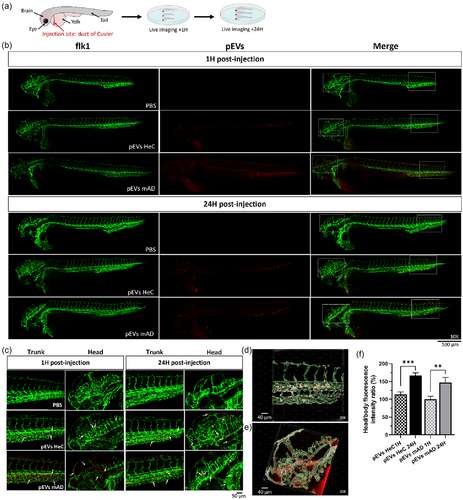
Fig. 6 In vivo biodistribution of pEVs in Tg(flk1:EGFP) zebrafish larvae at 2 dpf and 3 dpf. (a) 4.5 nL of PBS or pEVs from either HeC or mAD patients (1 1010 pEVs/mL) were microinjected into the blood circulation of 2 days post-fertilization larvae, and the biodistribution was followed 1 and 24 hpi by in vivo confocal microscopy. (b) Live confocal images (maximum projection) at 1 and 24 hpi of zebrafish larva bodies (10×), with pEVs in red and blood vessels in green and (c) magnification of the head and the trunk, with red pEVs are indicated by arrows. (d) Three-dimensional reconstruction on Imaris software of the trunk and (e) the head of a zebrafish larvae 1 hpi of PKH-pEVs. Endothelial cells are in green, PKH-pEVs from HeC patients are in red, and colocalization areas are in white. (f) Quantification of the head-to-total body fluorescence intensity ratio was performed using Zen 2.6 software, and comparisons were made using ordinary one-way ANOVA followed by Tukey's multiple comparisons test. Prior statistical analysis, the normality of each data set was evaluated. Data are expressed in mean ± SEM **p ≤ 0.05; ***p ≤ 0.005 with n = 7 per group.