
|
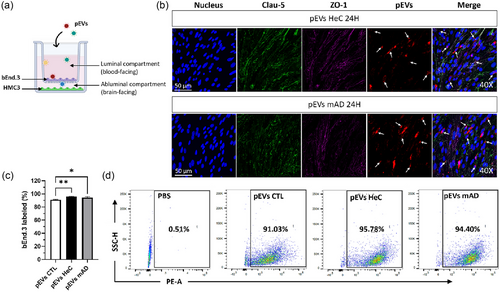
Fig. 4 Passage of pEVs through bEnd.3 endothelial cells in the presence of HMC3 microglial cells. (a) bEnd.3 cells were cultured on a Transwell for 10 days with HMC3 cells seeded at the bottom, and 1 1010 pEVs/mL were added for 24 h. (b) Uptake of PKH-pEVs (in red, indicated by arrows) by bEnd.3 cells (nuclei in blue, Clau-5 in green, ZO-1 in purple). (c)–(d) Percentage of bEnd.3 cells internalizing PKH-pEVs were quantified by flow cytometry and compared by ordinary one-way ANOVA. Prior statistical analysis, the normality of each data set was evaluated. Data are expressed in mean ± SEM with *p ≤ 0.5; **p ≤ 0.05; ****p ≤ 0.0005 with n ≥ 6 per group. pEVs, peripheral EVs.