
Fig. 2
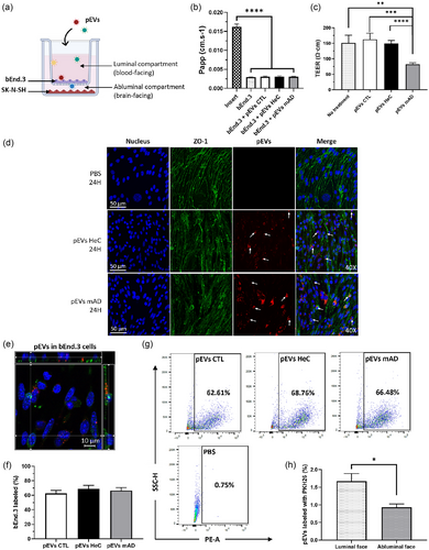
Passage of pEVs through bEnd.3 endothelial cells in the presence of SK-N-SH neuronal cells. (a) bEnd.3 cells were cultured on a Transwell for 10 days with SK-N-SH cells seeded at the bottom, then 1 1010 pEVs/mL were added at the luminal side for 24 h. (b) Papp of bEnd.3 cells untreated and treated with pEVs were compared by ordinary one-way ANOVA. (c) Measurement of the TEER after 24 h of treatment with either PBS or pEVs. Groups were compared by the Kruskal–Wallis test. (d) Confocal imaging of pEVs (in red, indicated by arrows) internalized by bEnd.3 cells (nucleus in blue, ZO-1 in green). (e) Internalization of PKH-pEVs (in red, indicated by arrows) by bEnd.3 cells (nucleus in blue, ZO-1 in green) with their nucleus labelled (in blue) (40×). (f)–(g) Percentage of bEnd.3 cells internalizing the PKH-pEVs from different groups were quantified by flow cytometry and compared by ordinary one-way ANOVA. (h) The percentage of PKH-pEVs in the luminal and abluminal media was assessed by nanoscale flow cytometry and compared by the Wilcoxon matched-pairs signed rank test. Prior statistical analysis, the normality of each data set was evaluated. Data are expressed in mean ± SEM with *p ≤ 0.5; **p ≤ 0.05; ***p ≤ 0.005; ****p ≤ 0.0005 with n ≥ 6 per group. pEVs, peripheral EVs. |