
Fig. 7
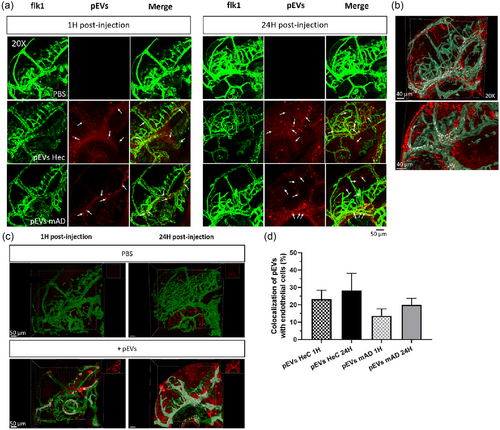
Internalization of pEVs by endothelial cells in Tg(flk1:EGFP) zebrafish larvae at 2 and 3 dpf and brain homing. 4.5 nL of PBS or pEVs from either HeC or mAD patients (1 1010 pEVs/mL) were microinjected into the blood circulation of 2 days post-fertilization larvae, and the biodistribution was followed 1 and 24 hpi by in vivo confocal microscopy. (a) Live confocal images (maximum projection) at 1 and 24 hpi of the head of zebrafish larvae (20×) after injection of either PBS or pEVs (in red, indicated by arrows). Endothelial cells are in green. (b)–(c) Three-dimensional reconstruction on Imaris software of the head of the zebrafish in control (CTL) condition or 1 and 24 hpi of PKH-pEVs. Endothelial cells are in green, PKH-pEVs from mAD patients are in red, and colocalization areas are in white. (d) The percentage of internalization of PKH-pEVs by endothelial cells was quantified by using Imaris software and analysed by ordinary one-way ANOVA followed by Tukey's multiple comparisons test. Prior statistical analysis, the normality of each data set was evaluated with n = 7 per group. |