
|
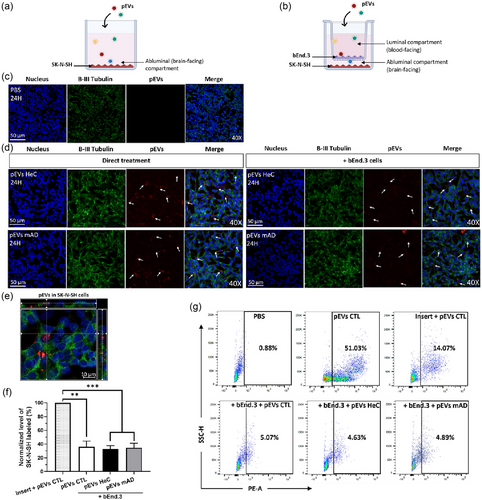
Fig. 3 Internalization of pEVs by SK-N-SH neuronal cells after their passage through bEnd.3 endothelial cells in vitro. (a) SK-N-SH cells were cultured at the bottom without or (b) with bEnd.3 cells seeded on a Transwell for 10 days, then 1 1010 pEVs/mL were added at the luminal side for 24 h. (c) Incubation with PBS for 24 h without PKH-pEVs. (d) Confocal imaging of PKH-pEVs (in red, indicated by arrows) internalized by SK-N-SH cells (nucleus in blue, β-III Tubulin in green) following a direct treatment or in the presence of bEnd.3 cells in the Transwell device. (e) Internalization of PKH-pEVs (in red, indicated by arrows) by SK-N-SH cells (40×). (f)–(g) Percentage of SK-N-SH cells internalizing PKH-pEVs quantified by flow cytometry and compared by ordinary one-way ANOVA, Tukey's multiple comparisons test. Prior statistical analysis, the normality of each data set was evaluated. Data are expressed in mean ± SEM with *p ≤ 0.5; **p ≤ 0.05; ***p ≤ 0.005; ****p ≤ 0.0005 with n ≥ 6 per group. pEVs, peripheral EVs.