
Fig. 9
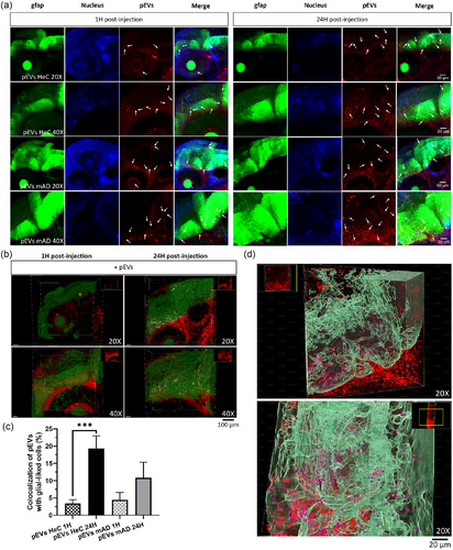
Brain homing of pEVs and their internalization by glial-like cells in the Tg(gfap:EGFP) zebrafish. (a) Live confocal images (maximum projection) at 1 and 24 hpi of the head of Tg(gfap1:EGFP) larvae (20× and 40×), with pEVs in red (indicated by arrows) and glial-like cells in green. (b) Three-dimensional reconstruction on Imaris software of the head of the zebrafish 1 and 24 hpi of PKH-pEVs from HeC (20×) and mAD (40×) patients. Glial-like cells are in green, PKH-pEVs are in red, and colocalization areas are in white. (c) The percentage of glial-like cells capturing PKH-pEVs was quantified by Zen 2.6 software and compared by ordinary one-way ANOVA followed by Tukey's multiple comparisons test. (d) Three-dimensional reconstruction on Imaris software of PKH-pEVs diffusion into the brain and their internalization by glial-like cells 24 hpi. Prior statistical analysis, the normality of each data set was evaluated. Data are expressed in mean ± SEM **p ≤ 0.05; ***p ≤ 0.005 with n = 7 per group. |