
- Title
-
Hyperaminoacidemia from interrupted glucagon signaling increases pancreatic acinar cell proliferation and size via mTORC1 and YAP pathways
- Authors
- Dai, C., Zhang, Y., Gong, Y., Bradley, A., Tang, Z., Sellick, K., Shrestha, S., Spears, E., Covington, B.A., Stanley, J., Jenkins, R., Richardson, T.M., Brantley, R.A., Coate, K., Saunders, D.C., Wright, J.J., Brissova, M., Dean, E.D., Powers, A.C., Chen, W.
- Source
- Full text @ iScience
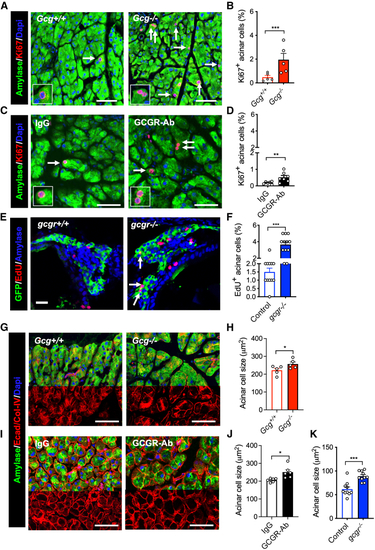
IGS increases acinar cell proliferation and cell size (A and C) Representative images of acinar tissue immunofluorescence of amylase (green) and Ki67 (red). DAPI (blue) was used to label the nuclei. The pancreas sections were from (B and D) Quantification of Ki67 positive acinar cell (n = 5–7). Arrows point to Ki67+ cells. (E) Representative immunofluorescent images of pancreas sections from 18 dpf zebrafish. Green (GFP), red (EdU), and blue (Amylase). Arrows, EdU+ acinar cells. (F) Quantification of EdU-positive acinar cells ( (G and I) Representative images of acinar tissue immunofluorescence of Amylase (Green), E-cadherin, and Collagen (Red). DAPI (blue) was used to label the nuclei. The pancreas sections were from (H and J) Measurements of acinar cell size (by area) in the two mouse models. (K) Average acinar cell size of control and |
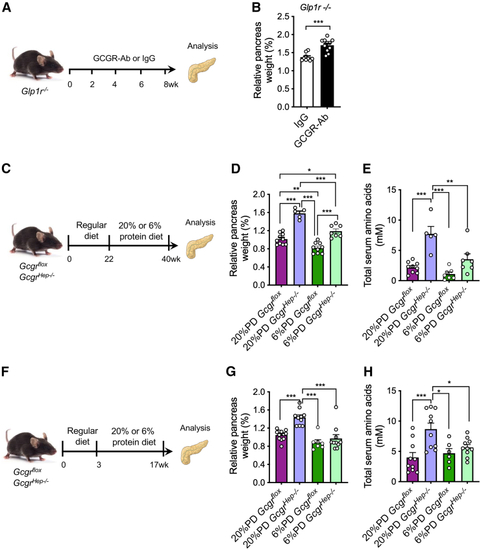
Hyperaminoacidemia, but not GLP-1, contributes to the increased pancreas mass in the GCGR-Ab-treated mice (A) Schematic of experimental design in (B) Pancreas mass in (C) Experimental outline depicting the treatment of IGS-induced pancreas expansion by a low protein diet. (D) Relative pancreas weight in (E) Total blood aa in (F) Experimental outline to prevent IGS-induced pancreas expansion. (G) Relative pancreas weight in (H) Total blood aa in |

Slc38a5 mediates acinar cell growth (A) The top 11 amino acid transporters expressed in mouse acinar cells ( (B) Slc38a5 expression in acinar cells of IgG and GCGR-Ab treated mice. CPM, count per million. Student’s t test. (C) Representative images of zebrafish pancreas from control, (D) Quantification of EdU+ acinar cells in control, (E) Acinar cell size in control, PHENOTYPE:
|
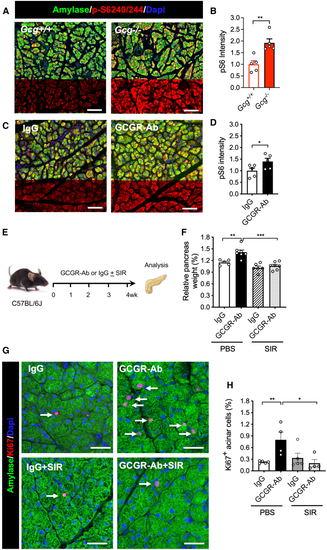
IGS activates mTORC1 pathway in acinar cells (A and C) Representative images of pancreas immunofluorescence from the 2 mouse models. Green, amylase; red, phosphor-S6 (240/244); blue, DAPI. (B and D) Quantification of pS6 intensity in (E) Schematic experimental design for treating mice with sirolimus (rapamycin) treatment. (F) Relative pancreas weight in the four groups (n = 5–6/group). (G) Representative immunofluorescence images of acinar tissues. Amylase, green; Ki67, red; DAPI, blue. Arrows point to Ki67+ acinar cells. (H) Quantification of Ki67+ acinar cells in the four groups ( |
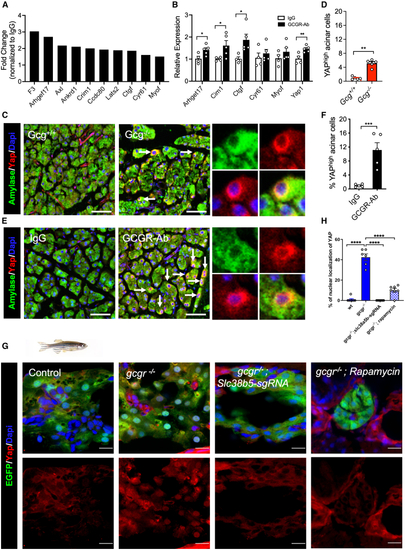
IGS activates the YAP/Taz pathway (A) Upregulation of YAP target genes in acinar cells from GCGR-Ab treated mice. Data are from RNA-seq. (B) RT-qPCR analysis of selected YAP target genes in mRNA from the pancreas of IgG and GCGR-Ab treated mice (n = 4–5/group, compared IgG vs. GCGR-Ab each gene). (C and E) Representative immunofluorescence images of YAP (red) in acinar cells (amylase, green) in the two mouse models. Arrows point to a high expression of YAP. Scale bar, 50 μm. (D and F) Quantifications of the percentage of acinar cells with high YAP expression ( (G) Representative immunofluorescence images of Yap in pancreas sections of WT, (H) Quantification of the percentage of acinar cell with nuclear Yap1. |
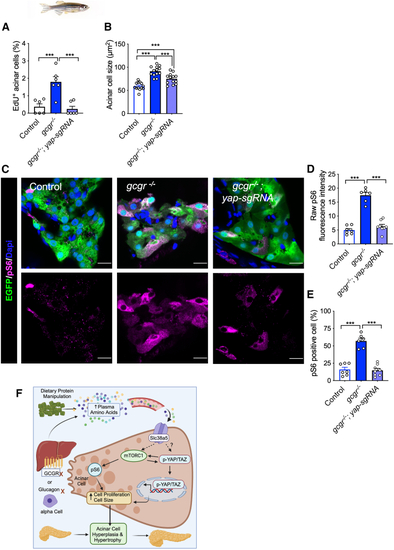
Yap1 is required for mTORC1 activation in (A and B) Quantification of the percentage of EdU-labeled acinar cells and the acinar cell size in the pancreas sections WT, (C) Representative immunofluorescence images of pS6(240/244) in pancreas sections. All fish carry the (D) Quantification of raw pS6 signal intensity in acinar cells of these fish. (E) Quantification of the percentage of pS6-positive acinar cells in the pancreas sections. (F) Proposed model of IGS-induced acinar cell hyperplasia and hypertrophy. |