
Figure 6
- ID
- ZDB-IMAGE-250109-281
- Antibodies
- Publication
- Dai et al., 2024 - Hyperaminoacidemia from interrupted glucagon signaling increases pancreatic acinar cell proliferation and size via mTORC1 and YAP pathways
- All Figures
- Figures for Dai et al., 2024
|
Figure 6
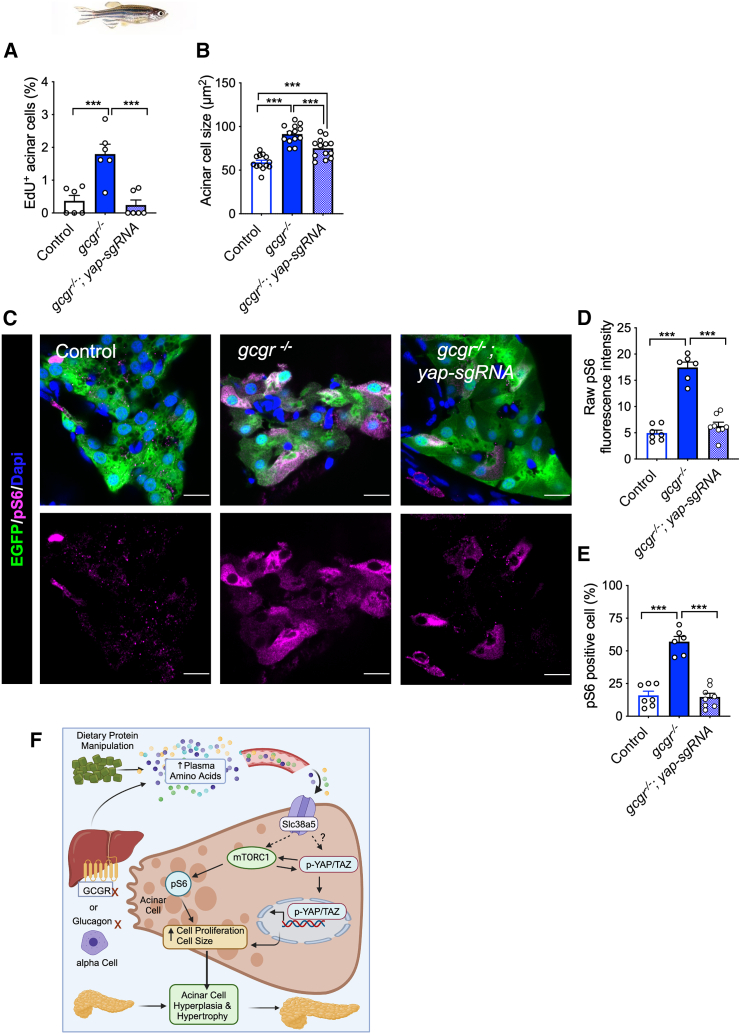
Yap1 is required for mTORC1 activation in
(A and B) Quantification of the percentage of EdU-labeled acinar cells and the acinar cell size in the pancreas sections WT,
(C) Representative immunofluorescence images of pS6(240/244) in pancreas sections. All fish carry the
(D) Quantification of raw pS6 signal intensity in acinar cells of these fish.
(E) Quantification of the percentage of pS6-positive acinar cells in the pancreas sections.
(F) Proposed model of IGS-induced acinar cell hyperplasia and hypertrophy.