
Figure 3
- ID
- ZDB-IMAGE-250109-278
- Publication
- Dai et al., 2024 - Hyperaminoacidemia from interrupted glucagon signaling increases pancreatic acinar cell proliferation and size via mTORC1 and YAP pathways
- All Figures
- Figures for Dai et al., 2024
|
Figure 3
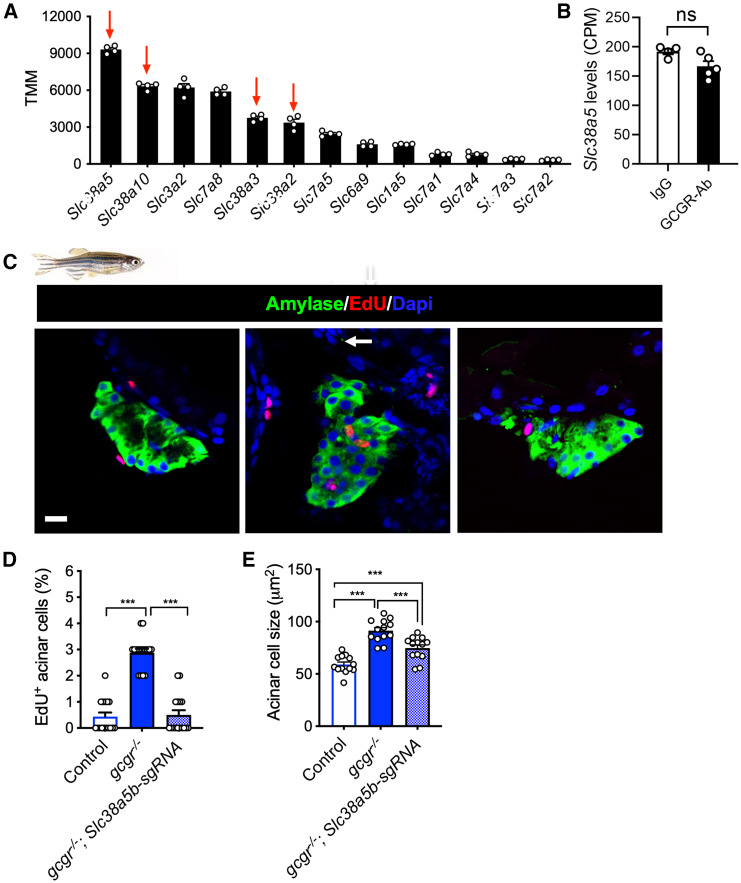
Slc38a5 mediates acinar cell growth
(A) The top 11 amino acid transporters expressed in mouse acinar cells (
(B) Slc38a5 expression in acinar cells of IgG and GCGR-Ab treated mice. CPM, count per million. Student’s t test.
(C) Representative images of zebrafish pancreas from control,
(D) Quantification of EdU+ acinar cells in control,
(E) Acinar cell size in control,