
Figure 5
- ID
- ZDB-IMAGE-250109-280
- Genes
- Publication
- Dai et al., 2024 - Hyperaminoacidemia from interrupted glucagon signaling increases pancreatic acinar cell proliferation and size via mTORC1 and YAP pathways
- All Figures
- Figures for Dai et al., 2024
|
Figure 5
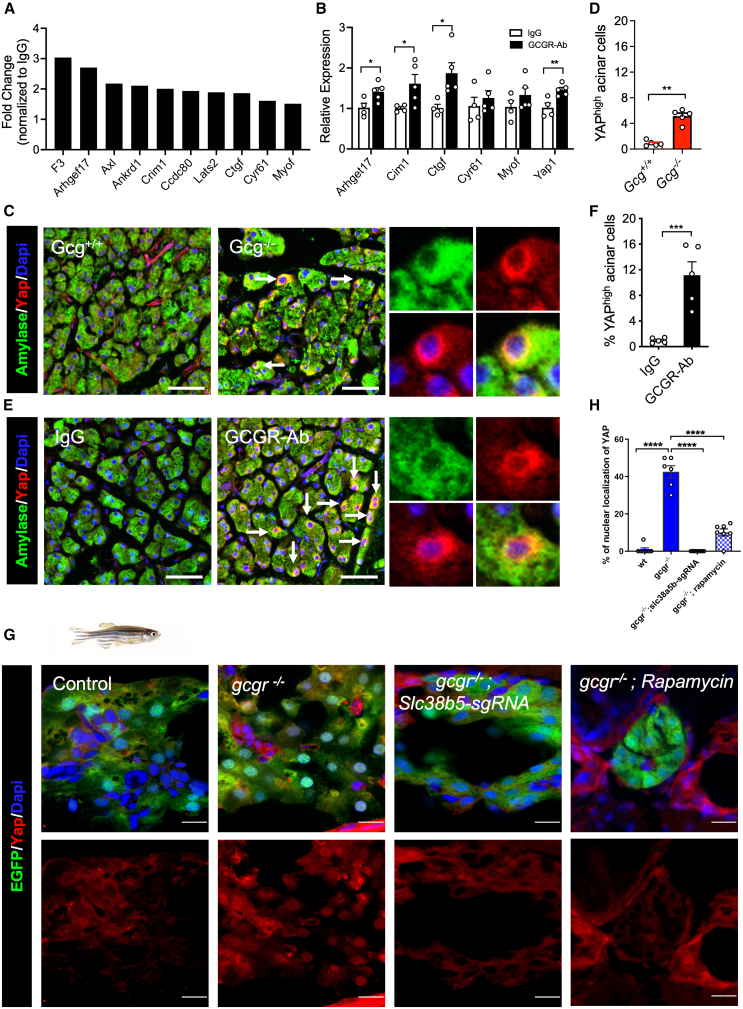
IGS activates the YAP/Taz pathway
(A) Upregulation of YAP target genes in acinar cells from GCGR-Ab treated mice. Data are from RNA-seq.
(B) RT-qPCR analysis of selected YAP target genes in mRNA from the pancreas of IgG and GCGR-Ab treated mice (n = 4–5/group, compared IgG vs. GCGR-Ab each gene).
(C and E) Representative immunofluorescence images of YAP (red) in acinar cells (amylase, green) in the two mouse models. Arrows point to a high expression of YAP. Scale bar, 50 μm.
(D and F) Quantifications of the percentage of acinar cells with high YAP expression (
(G) Representative immunofluorescence images of Yap in pancreas sections of WT,
(H) Quantification of the percentage of acinar cell with nuclear Yap1.