
Figure 6
- ID
- ZDB-FIG-250109-277
- Publication
- Dai et al., 2024 - Hyperaminoacidemia from interrupted glucagon signaling increases pancreatic acinar cell proliferation and size via mTORC1 and YAP pathways
- Other Figures
- All Figure Page
- Back to All Figure Page
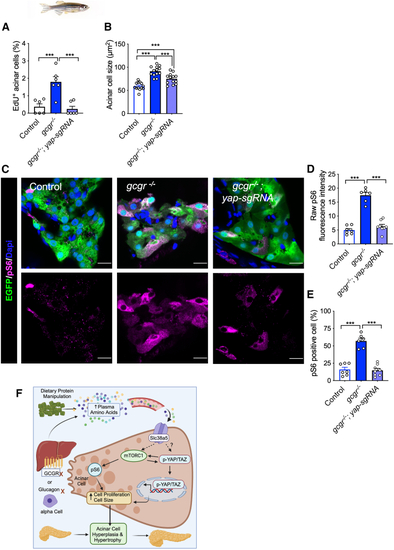
Yap1 is required for mTORC1 activation in (A and B) Quantification of the percentage of EdU-labeled acinar cells and the acinar cell size in the pancreas sections WT, (C) Representative immunofluorescence images of pS6(240/244) in pancreas sections. All fish carry the (D) Quantification of raw pS6 signal intensity in acinar cells of these fish. (E) Quantification of the percentage of pS6-positive acinar cells in the pancreas sections. (F) Proposed model of IGS-induced acinar cell hyperplasia and hypertrophy. |
| Antibody: | |
|---|---|
| Fish: | |
| Knockdown Reagents: | |
| Anatomical Term: | |
| Stage: | Adult |
| Fish: | |
|---|---|
| Knockdown Reagents: | |
| Observed In: | |
| Stage: | Adult |