
Figure 2
- ID
- ZDB-IMAGE-250109-276
- Publication
- Dai et al., 2024 - Hyperaminoacidemia from interrupted glucagon signaling increases pancreatic acinar cell proliferation and size via mTORC1 and YAP pathways
- All Figures
- Figures for Dai et al., 2024
|
Figure 2
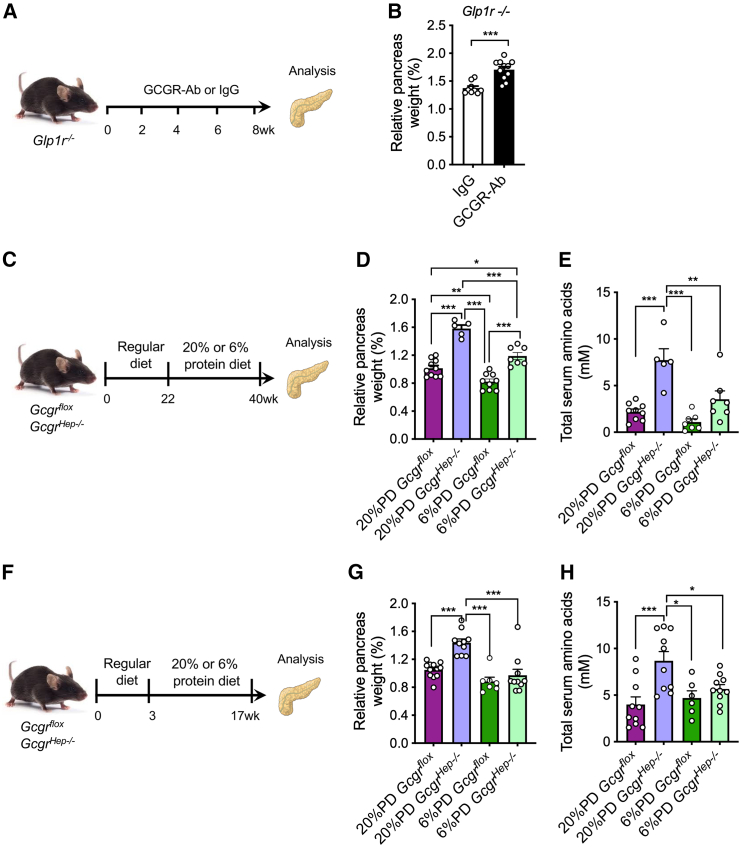
Hyperaminoacidemia, but not GLP-1, contributes to the increased pancreas mass in the GCGR-Ab-treated mice
(A) Schematic of experimental design in
(B) Pancreas mass in
(C) Experimental outline depicting the treatment of IGS-induced pancreas expansion by a low protein diet.
(D) Relative pancreas weight in
(E) Total blood aa in
(F) Experimental outline to prevent IGS-induced pancreas expansion.
(G) Relative pancreas weight in
(H) Total blood aa in