
Figure 4
- ID
- ZDB-FIG-250109-275
- Publication
- Dai et al., 2024 - Hyperaminoacidemia from interrupted glucagon signaling increases pancreatic acinar cell proliferation and size via mTORC1 and YAP pathways
- Other Figures
- All Figure Page
- Back to All Figure Page
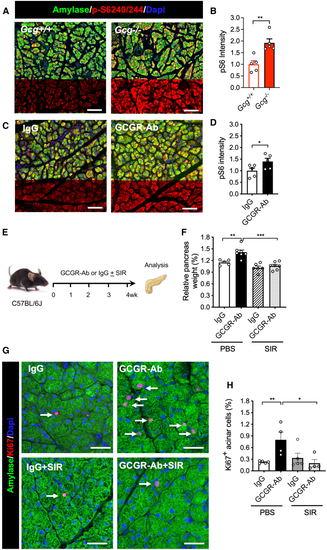
IGS activates mTORC1 pathway in acinar cells (A and C) Representative images of pancreas immunofluorescence from the 2 mouse models. Green, amylase; red, phosphor-S6 (240/244); blue, DAPI. (B and D) Quantification of pS6 intensity in (E) Schematic experimental design for treating mice with sirolimus (rapamycin) treatment. (F) Relative pancreas weight in the four groups (n = 5–6/group). (G) Representative immunofluorescence images of acinar tissues. Amylase, green; Ki67, red; DAPI, blue. Arrows point to Ki67+ acinar cells. (H) Quantification of Ki67+ acinar cells in the four groups ( |