FIGURE SUMMARY
Title

How Tumors Affect Hemodynamics: A Diffusion Study on the Zebrafish Transplantable Model of Medullary Thyroid Carcinoma by Selective Plane Illumination Microscopy

Authors
Carra, S., Gaudenzi, G., Franceschetti, G., Collini, M., Sironi, L., Bouzin, M., Persani, L., Chirico, G., Vitale, G., D'Alfonso, L.
Source
Full text @ Int. J. Mol. Sci.

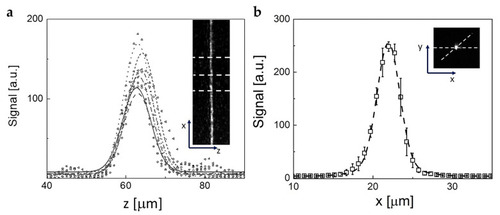
Analysis of the time stack of images acquired for 5 min (5 s time steps) after the injection of very concentrated rhodamine in solidified agarose. (a) One frame acquired a few seconds after injection. The dashed blue hemi-circle indicates the cross-section of the needle for injection. The red rectangle represents one of the ROIs over which the intensity profile was measured versus time at different distances from the injection point. (bd) Intensity profiles measured on ROIs at increasing distance from the injection point (in the legend), as described in the legend, from samples at different agarose concentrations (1, 2 and 5%, respectively), together with their best fit to Equation (4) (continuous line).

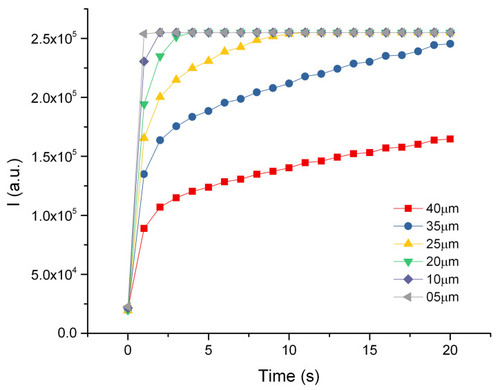
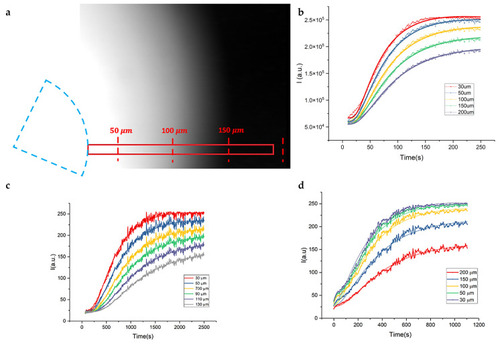
Intensity profiles of diffusing rhodamine in jellified 1% agarose solution. Different intensity profiles are recorded at different distances from the injection point as a function of time.

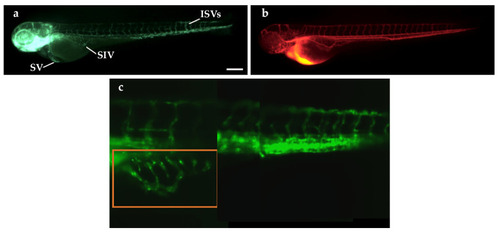
Microangiography assay in Tg(fli1a:EGFP)y1 embryos at 3 dpf and 3D reconstruction of the vasculature. (a) Fluorescence image of a 3 dpf Tg(fli1a:EGFP)y1 embryo, showing the entire vascular tree in green. (b) The red emission of the dextran rhodamine injected into the blood flow of the same embryo by microangiography. This image was taken immediately after the microangiography. SV: sinus venosus; SIV: subintestinal vein; ISVs: intersegmental vessels. Scale bar: 100 µm. (c) Reconstruction of the vasculature at the level of yolk and tail of a 3 dpf embryo made by means of SPIM microscopy. The red-boxed area corresponds to the SIV region. The image is the stitching of three sheet images. Embryos are shown anterior to the left.

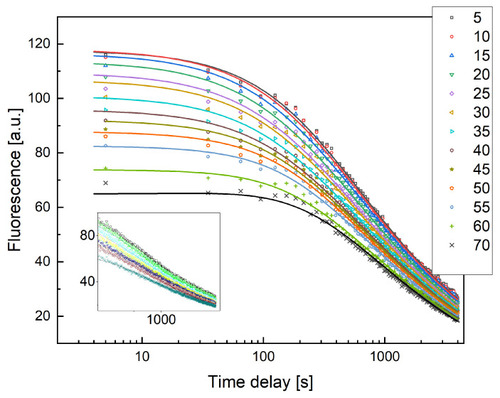
Fluorescent dextran intensity profiles versus time measured at increasing distances from the SIV plexus for a control zebrafish embryo, as shown in the legend. Solid lines are the best fit of the data to Equation (4), performed to determine the value of the diffusion coefficient D, kept as a shared global parameter. The time delay between the injection and the observation was set to t0320 s. The solid lines are the best fit to the data with best fit value of the diffusion coefficient D=12±0.2μm2s.

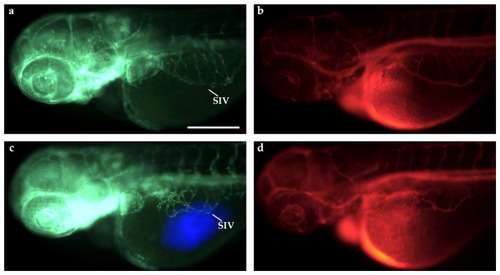
Microangiography assays in TT-xenografted and control Tg(fli1a:EGFP)y1 embryos at 3 dpf. Fluorescence images of 3 dpf Tg(fli1a:EGFP)y1 embryos, injected at 2 dpf with PBS as control (a,b) and with blue fluorescence stained TT cells (c,d) at the level of the subperidermal cavity near the SIV, and by microangiography (b,d). The dextran tetramethylrhodamine signal is red. Grafted larvae showed vessels in green that sprout from the SIV towards the xenograft in blue (c). Embryos are shown anterior to the left. SIV: subintestinal vein. Scale bar: 100 µm.

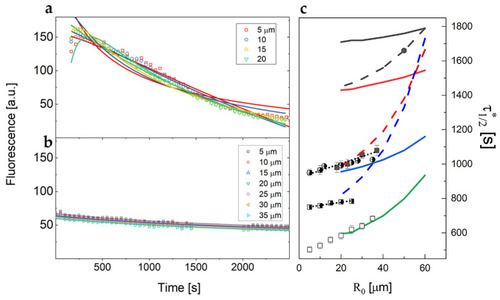
Examples of fluorescent dextran intensity profiles over time measured on different xenografted zebrafish samples at different distances from the injection point. Solid lines are the best fit with D=1.9±0.22μm2s  (a) and D=0.82±0.02μm2s  (b). (c) Trend of the half value time τ12 as a function of the distance, R0, of the observation volume from the injection volume for control embryos (open squares) and for three different xenotransplanted embryos (filled squares, half-filled squares and circles). Solid lines correspond to the simulations for D = 10μm2s and t0=1800 s, 1200s, 600 s, 300 s, from top to bottom. The dashed lines correspond to the simulations for D = 4μm2s and t0=1200 s, 600 s, 450 s, from top to bottom. The dotted lines are the best fit linear trends to the data.

(a) Schematics of the main parts constituting the portable SPIM setup employed in this study. The source beam is expanded by the beam expander (BE) composed of lenses L1 and L2, filtered by the slit and shaped as a light sheet by the cylindrical lens (CL) and the excitation objective (Eobj). The light is collected at a right angle with respect to the excitation by a 4f system composed of the collection microscope objective (Dobj) and the tube lens (TL) and the image is created on a CMOS camera. (b) Schematics of the 3D-printed immersion chamber.

(a) Example of the profiles of the cross section of the light sheet image acquired by means of a reflecting mirror (640 × 512 pixels, 880 µm × 700 µm). The inset reports the image of the sheet cross-section on which the dashed lines indicate only a few of the sections that are analyzed in the main panel. The lines in the main panel are the best fit of the profiles to a Gaussian function with an average fitting FWHM = 7.8 ± 1.3 µm. (b) Example of the average cross-section of a single 1 μm fluorescent bead imaged in the light sheet used to determine the value of the PSF of the setup (640 × 512 pixels, 880 × 700 µm2). The dashed line is the best fit Gaussian function to the data with FWHM = 3.2±0.4 μm. The inset shows an example of the image of a microsphere in the light sheet.

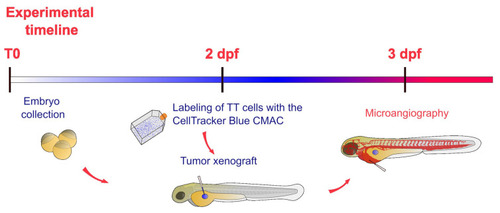
Schematic representation of the experimental timeline of experiments in zebrafish embryos. After the collection (T0), zebrafish embryos were incubated at 28 °C up to 2 dpf. At this stage labeled TT cells were implanted in embryos. After the xenograft, embryos were incubated at 32 °C for 24 h. The day after, microangiography assays were performed on 3 dpf embryos.

Acknowledgments
This image is the copyrighted work of the attributed author or publisher, and ZFIN has permission only to display this image to its users. Additional permissions should be obtained from the applicable author or publisher of the image. Full text @ Int. J. Mol. Sci.