
FIGURE
Figure 4
- ID
- ZDB-FIG-250110-85
- Publication
- Carra et al., 2024 - How Tumors Affect Hemodynamics: A Diffusion Study on the Zebrafish Transplantable Model of Medullary Thyroid Carcinoma by Selective Plane Illumination Microscopy
- Other Figures
- All Figure Page
- Back to All Figure Page
Figure 4
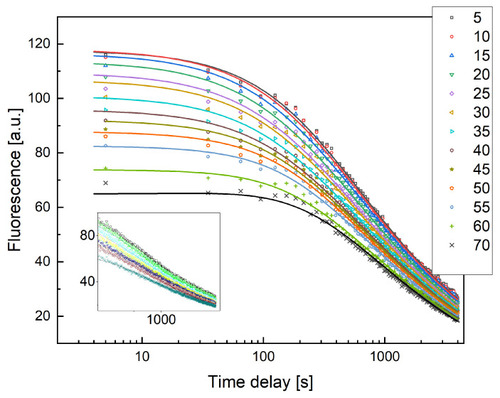
Fluorescent dextran intensity profiles versus time measured at increasing distances from the SIV plexus for a control zebrafish embryo, as shown in the legend. Solid lines are the best fit of the data to Equation (4), performed to determine the value of the diffusion coefficient D, kept as a shared global parameter. The time delay between the injection and the observation was set to |
Expression Data
Expression Detail
Antibody Labeling
Phenotype Data
Phenotype Detail
Acknowledgments
This image is the copyrighted work of the attributed author or publisher, and
ZFIN has permission only to display this image to its users.
Additional permissions should be obtained from the applicable author or publisher of the image.
Full text @ Int. J. Mol. Sci.