FIGURE

Figure 1

ID
ZDB-FIG-250110-82
Publication
Carra et al., 2024 - How Tumors Affect Hemodynamics: A Diffusion Study on the Zebrafish Transplantable Model of Medullary Thyroid Carcinoma by Selective Plane Illumination Microscopy
Other Figures
All Figure Page
Back to All Figure Page
Figure 1

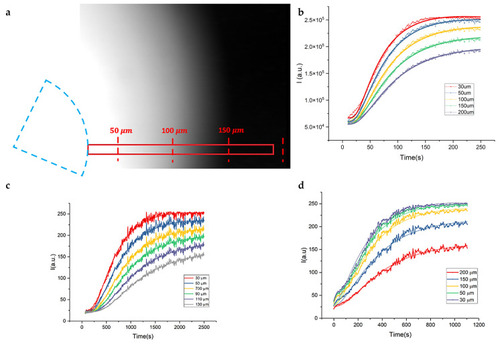
Analysis of the time stack of images acquired for 5 min (5 s time steps) after the injection of very concentrated rhodamine in solidified agarose. (a) One frame acquired a few seconds after injection. The dashed blue hemi-circle indicates the cross-section of the needle for injection. The red rectangle represents one of the ROIs over which the intensity profile was measured versus time at different distances from the injection point. (bd) Intensity profiles measured on ROIs at increasing distance from the injection point (in the legend), as described in the legend, from samples at different agarose concentrations (1, 2 and 5%, respectively), together with their best fit to Equation (4) (continuous line).

Expression Data

Expression Detail
Antibody Labeling
Phenotype Data

Phenotype Detail
Acknowledgments
This image is the copyrighted work of the attributed author or publisher, and ZFIN has permission only to display this image to its users. Additional permissions should be obtained from the applicable author or publisher of the image. Full text @ Int. J. Mol. Sci.