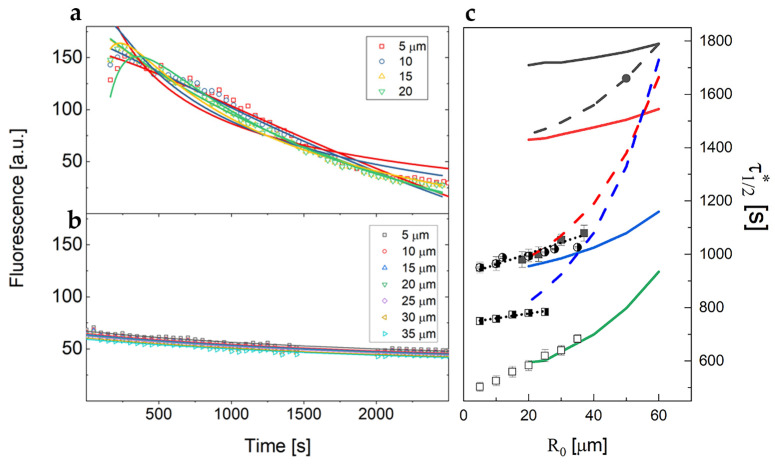
IMAGE

Figure 6

ID
ZDB-IMAGE-250110-89
Source
Figures for Carra et al., 2024
Image
Figure Caption

Figure 6

Examples of fluorescent dextran intensity profiles over time measured on different xenografted zebrafish samples at different distances from the injection point. Solid lines are the best fit with D=1.9±0.22μm2s  (a) and D=0.82±0.02μm2s  (b). (c) Trend of the half value time τ12 as a function of the distance, R0, of the observation volume from the injection volume for control embryos (open squares) and for three different xenotransplanted embryos (filled squares, half-filled squares and circles). Solid lines correspond to the simulations for D = 10μm2s and t0=1800 s, 1200s, 600 s, 300 s, from top to bottom. The dashed lines correspond to the simulations for D = 4μm2s and t0=1200 s, 600 s, 450 s, from top to bottom. The dotted lines are the best fit linear trends to the data.

Acknowledgments
This image is the copyrighted work of the attributed author or publisher, and ZFIN has permission only to display this image to its users. Additional permissions should be obtained from the applicable author or publisher of the image. Full text @ Int. J. Mol. Sci.