IMAGE

Figure 5

ID
ZDB-IMAGE-250110-88
Source
Figures for Carra et al., 2024
Image
Figure Caption

Figure 5

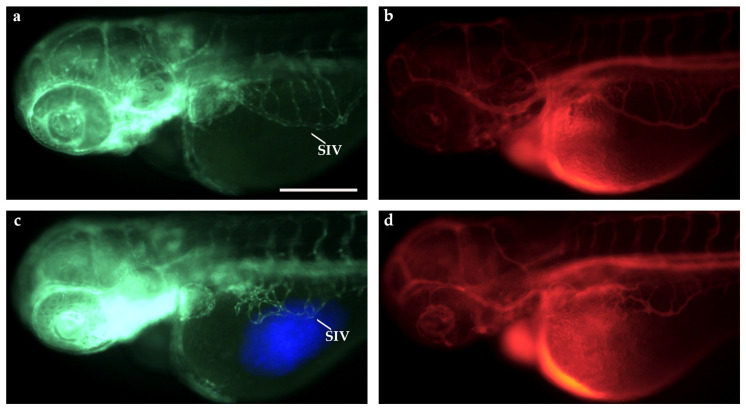
Microangiography assays in TT-xenografted and control Tg(fli1a:EGFP)y1 embryos at 3 dpf. Fluorescence images of 3 dpf Tg(fli1a:EGFP)y1 embryos, injected at 2 dpf with PBS as control (a,b) and with blue fluorescence stained TT cells (c,d) at the level of the subperidermal cavity near the SIV, and by microangiography (b,d). The dextran tetramethylrhodamine signal is red. Grafted larvae showed vessels in green that sprout from the SIV towards the xenograft in blue (c). Embryos are shown anterior to the left. SIV: subintestinal vein. Scale bar: 100 µm.

Acknowledgments
This image is the copyrighted work of the attributed author or publisher, and ZFIN has permission only to display this image to its users. Additional permissions should be obtained from the applicable author or publisher of the image. Full text @ Int. J. Mol. Sci.