
Image
|
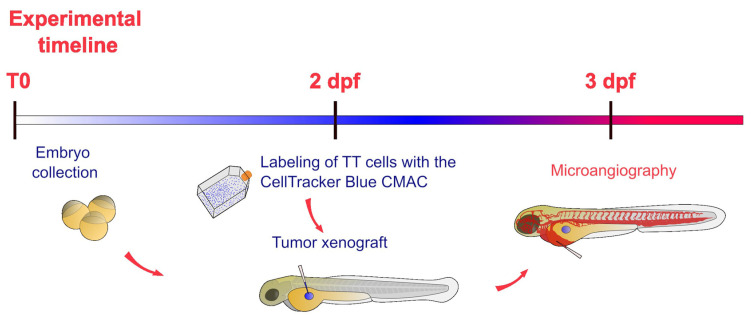
Figure Caption
Figure 9
Schematic representation of the experimental timeline of experiments in zebrafish embryos. After the collection (T0), zebrafish embryos were incubated at 28 °C up to 2 dpf. At this stage labeled TT cells were implanted in embryos. After the xenograft, embryos were incubated at 32 °C for 24 h. The day after, microangiography assays were performed on 3 dpf embryos.
Acknowledgments
This image is the copyrighted work of the attributed author or publisher, and
ZFIN has permission only to display this image to its users.
Additional permissions should be obtained from the applicable author or publisher of the image.
Full text @ Int. J. Mol. Sci.