IMAGE

Figure 3

ID
ZDB-IMAGE-250110-86
Source
Figures for Carra et al., 2024
Image
Figure Caption

Figure 3

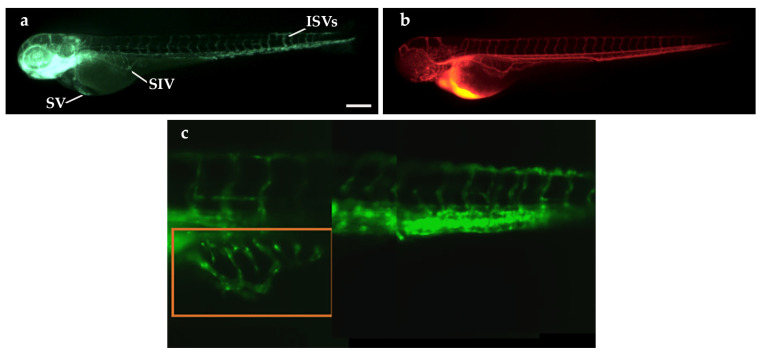
Microangiography assay in Tg(fli1a:EGFP)y1 embryos at 3 dpf and 3D reconstruction of the vasculature. (a) Fluorescence image of a 3 dpf Tg(fli1a:EGFP)y1 embryo, showing the entire vascular tree in green. (b) The red emission of the dextran rhodamine injected into the blood flow of the same embryo by microangiography. This image was taken immediately after the microangiography. SV: sinus venosus; SIV: subintestinal vein; ISVs: intersegmental vessels. Scale bar: 100 µm. (c) Reconstruction of the vasculature at the level of yolk and tail of a 3 dpf embryo made by means of SPIM microscopy. The red-boxed area corresponds to the SIV region. The image is the stitching of three sheet images. Embryos are shown anterior to the left.

Acknowledgments
This image is the copyrighted work of the attributed author or publisher, and ZFIN has permission only to display this image to its users. Additional permissions should be obtained from the applicable author or publisher of the image. Full text @ Int. J. Mol. Sci.