
- Title
-
Protocol for quantifying xenografted human cancer cells in zebrafish larvae using Cellpose
- Authors
- Köpke, K., Lembke, C.S., Oosterhof, N., Dijkstra, E.S.C., Paridaen, J.T.M.L.
- Source
- Full text @ STAR Protoc
|
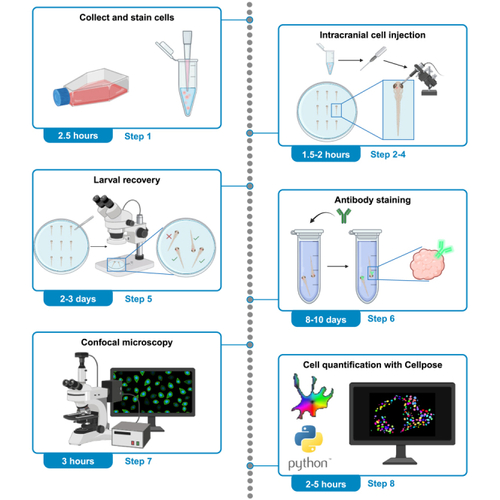
Culturing of Glioblastoma stem cells (A and B) show GG16 cell spheres in suspension right before passaging. Note that spheres are visible by eye and that the color of the medium is turning orange. (C) shows microscopic image of GG16 spheres at 4x magnification before passaging. The arrowhead indicates a blackish center of a sphere. Scale bar = 200 μm. |
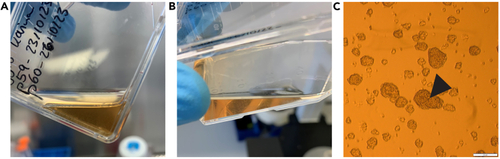
Sphere dissociation using Accutase (A) Shows cells accumulating at the bottom of the tube after incubation with Accutase. (B) Shows resuspension of the cells in Accutase after gentle flicking of the tube. |
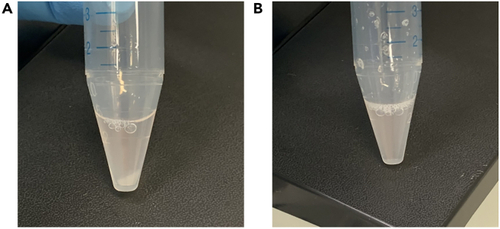
Injection needle preparation (A) Shows correctly pulled and closed injection needle. (B) Shows ejection volume of roughly 500 pL in mineral oil, with micrometer stage in the background. (C) Shows the approximate size of an opened needle tip with micrometer stage in background. Scale bar = 500 μm (B) and 250 μm (C). |
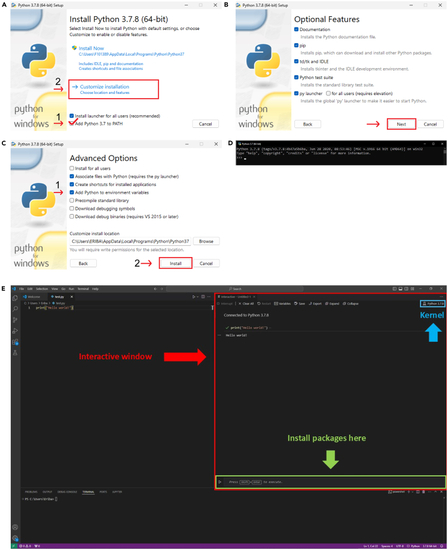
Prepare software and computing environment (A–C) show the steps for installing python. (D) Shows the window that appears when python is installed correctly. (E) Shows an overview of the Integrated Development Environment Visual Studio Code with indications for the interactive window, the kernel and where to install packages. |
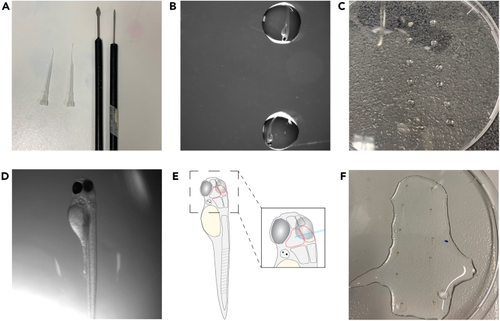
Prepare and mount larvae for injection (A) Shows utensils used for positioning and later removal of agarose. (B) Shows larvae placed in a drop of medium in the lid of a 10 cm Petri dish. (C) Shows an overview of larvae in drops of medium. Larvae are lined up from top to bottom and in rows to later facilitate the injection procedure. (D) Shows a larva positioned in agarose. Note the slight tilt of the body to the right lateral side. (E) Shows a schematic of a positioned larva with the midbrain outlined in red as well as the brain enlarged to show correct needle positioning. (F) Shows agarose-embedded larvae with added E3 and 1x tricaine solution on top. |
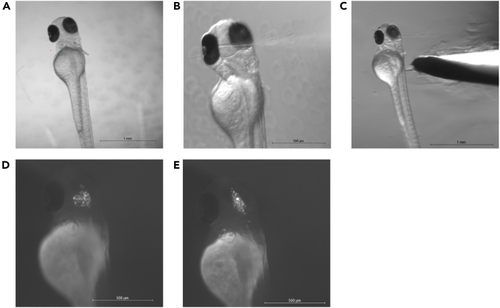
Intracranial cell injection and larva recovery (A) Shows positioning of larva in agarose for intracranial injection. Note the slight lateral tilt towards the injection needle to the right. (B) Shows the insertion of the injection needle to the left hemisphere of the midbrain. In C, the larva is removed from the agarose by scraping the agarose away at the height of the yolk. (D and E) Show fluorescently labeled cells in the midbrain (D) and the midbrain ventricle (E). Scale bar A-C = 1000 μm and D-E = 500 μm. |
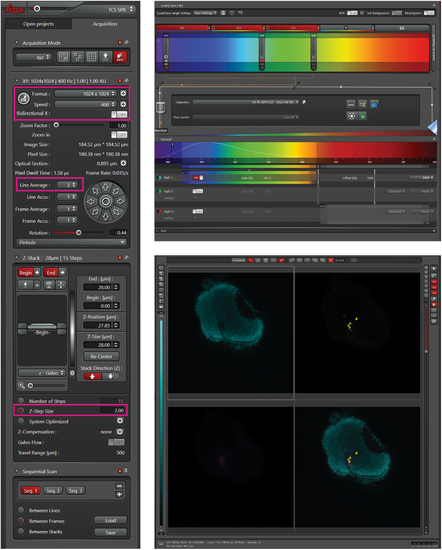
Confocal microscopy setting The left panel shows the overview of standard setting for confocal microscopy. The settings in pink boxes are essential to be able to generate images that can be used for quantification with Cellpose. This includes an image format of 1024 × 1024 with a pixel size of 0.38 μm. The upper right panel shows laser settings to detect cells. The lower right panel shows an overview of example zebrafish brain with zebrafish nuclei in cyan and human cells in yellow. |
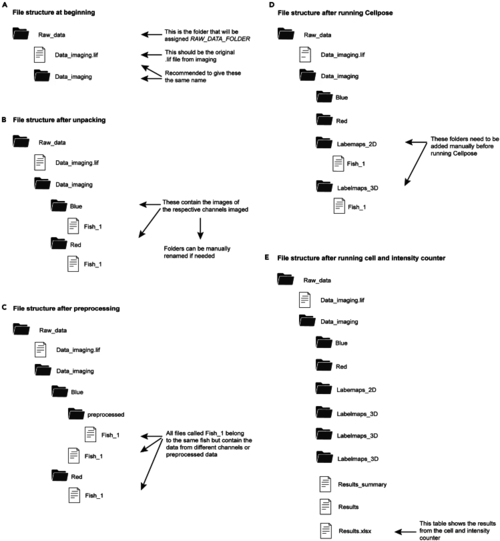
Overview of the file structure when counting nucleoli The figure shows the structure of folders (black icon) and files (white icon) during different steps of the quantification process using the provided code. Panel A shows the structure at the beginning. Panel B shows the structure after unpacking the image files. Panel C shows the structure after preprocessing the unpacked image files. Panel D shows the file structure after running the Cellpose algorithm. Panel E shows the file structure at the end of the section “ |
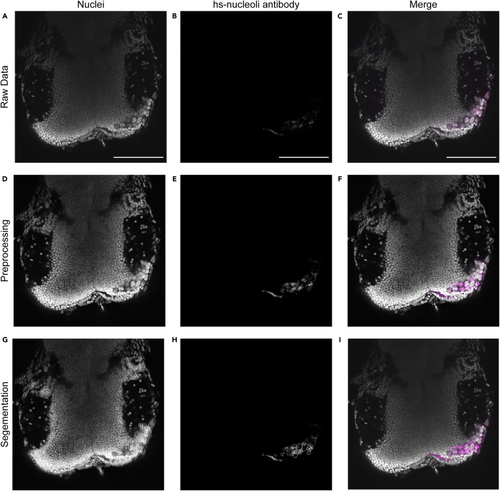
Expected outcomes Shown are different steps for the quantification of human cells using Cellpose. (A–C) Show single slices of raw data of 2 dpf zebrafish midbrain with GG16 cells with extracted channels for nuclei (A), hs-nucleoli antibody (B) and merge of these two channels with nucleoli in magenta (C). (D–F) Show the same images after preprocessing. (G) Shows the segmentation of nuclei used by Cellpose to quantify hs-nucleoli positive nuclei. (H) Shows the segmentation of nuclei with respective hs-nuceloli antibody staining within. (I) Shows the merged image with human nuclei positive for hs-nucleoli antibody outlined in magenta. Scale bar = 100 μm. |
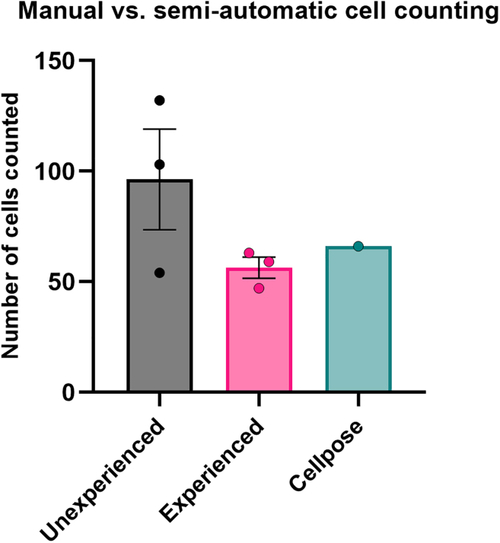
Quantification of human cells Number of GG16 cells present in the zebrafish midbrain for 1 example larva. The number of cells was determined manually, either by researchers unfamiliar with manual cell counting (unexperienced, mean = 96.3, |