
FIGURE
Figure 8
Figure 8
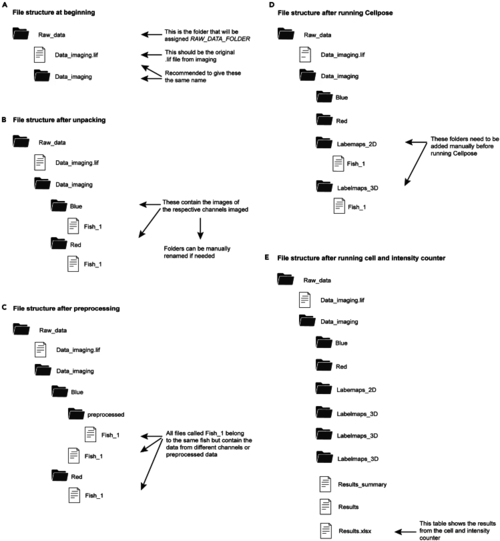
Overview of the file structure when counting nucleoli The figure shows the structure of folders (black icon) and files (white icon) during different steps of the quantification process using the provided code. Panel A shows the structure at the beginning. Panel B shows the structure after unpacking the image files. Panel C shows the structure after preprocessing the unpacked image files. Panel D shows the file structure after running the Cellpose algorithm. Panel E shows the file structure at the end of the section “ |
Expression Data
Expression Detail
Antibody Labeling
Phenotype Data
Phenotype Detail
Acknowledgments
This image is the copyrighted work of the attributed author or publisher, and
ZFIN has permission only to display this image to its users.
Additional permissions should be obtained from the applicable author or publisher of the image.
Full text @ STAR Protoc