
Image
|
Figure Caption
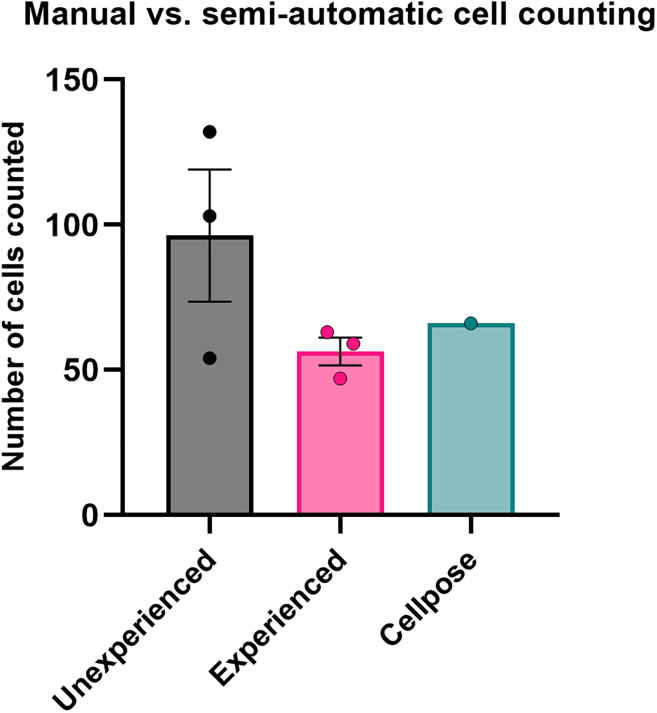
Figure 10
Quantification of human cells
Number of GG16 cells present in the zebrafish midbrain for 1 example larva. The number of cells was determined manually, either by researchers unfamiliar with manual cell counting (unexperienced, mean = 96.3,
Acknowledgments
This image is the copyrighted work of the attributed author or publisher, and
ZFIN has permission only to display this image to its users.
Additional permissions should be obtained from the applicable author or publisher of the image.
Full text @ STAR Protoc