
FIGURE
Figure 1
Figure 1
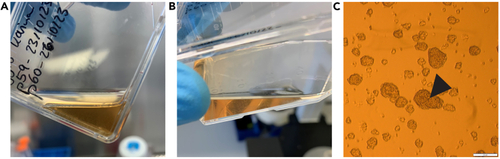
Culturing of Glioblastoma stem cells (A and B) show GG16 cell spheres in suspension right before passaging. Note that spheres are visible by eye and that the color of the medium is turning orange. (C) shows microscopic image of GG16 spheres at 4x magnification before passaging. The arrowhead indicates a blackish center of a sphere. Scale bar = 200 μm. |
Expression Data
Expression Detail
Antibody Labeling
Phenotype Data
Phenotype Detail
Acknowledgments
This image is the copyrighted work of the attributed author or publisher, and
ZFIN has permission only to display this image to its users.
Additional permissions should be obtained from the applicable author or publisher of the image.
Full text @ STAR Protoc