
FIGURE
Figure 6
Figure 6
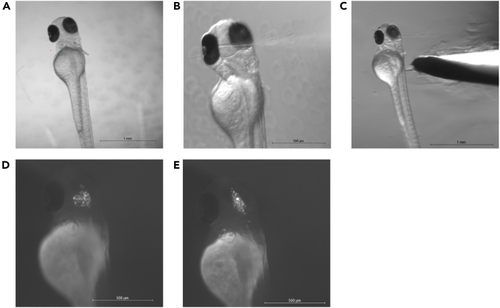
Intracranial cell injection and larva recovery (A) Shows positioning of larva in agarose for intracranial injection. Note the slight lateral tilt towards the injection needle to the right. (B) Shows the insertion of the injection needle to the left hemisphere of the midbrain. In C, the larva is removed from the agarose by scraping the agarose away at the height of the yolk. (D and E) Show fluorescently labeled cells in the midbrain (D) and the midbrain ventricle (E). Scale bar A-C = 1000 μm and D-E = 500 μm. |
Expression Data
Expression Detail
Antibody Labeling
Phenotype Data
Phenotype Detail
Acknowledgments
This image is the copyrighted work of the attributed author or publisher, and
ZFIN has permission only to display this image to its users.
Additional permissions should be obtained from the applicable author or publisher of the image.
Full text @ STAR Protoc