
|
Figure 9
Expected outcomes
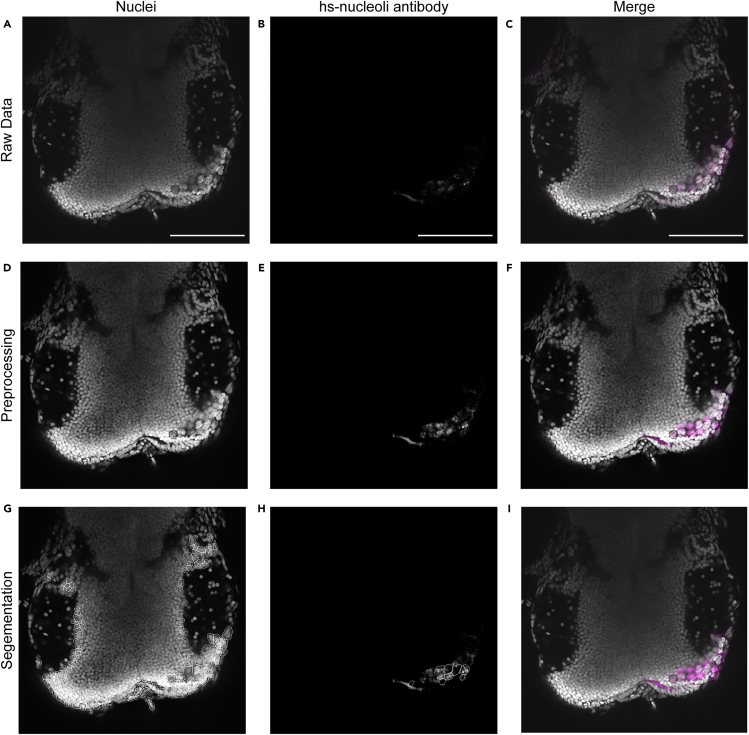
Shown are different steps for the quantification of human cells using Cellpose.
(A–C) Show single slices of raw data of 2 dpf zebrafish midbrain with GG16 cells with extracted channels for nuclei (A), hs-nucleoli antibody (B) and merge of these two channels with nucleoli in magenta (C).
(D–F) Show the same images after preprocessing.
(G) Shows the segmentation of nuclei used by Cellpose to quantify hs-nucleoli positive nuclei.
(H) Shows the segmentation of nuclei with respective hs-nuceloli antibody staining within.
(I) Shows the merged image with human nuclei positive for hs-nucleoli antibody outlined in magenta. Scale bar = 100 μm.