
- Title
-
The metalloproteinase PAPP-A is required for IGF-dependent chondrocyte differentiation and organization
- Authors
- Harboe, M., Kjaer-Sorensen, K., Füchtbauer, E.M., Fenton, R.A., Thomsen, J.S., Brüel, A., Oxvig, C.
- Source
- Full text @ Sci. Rep.
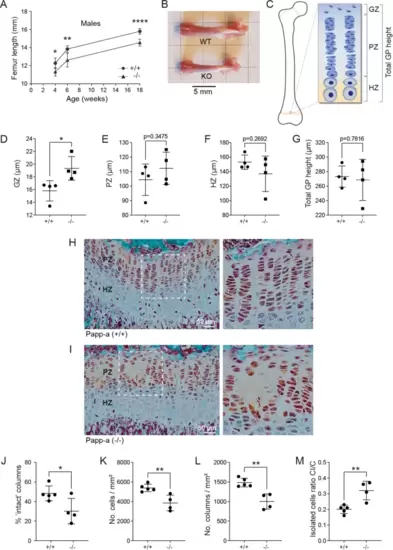
PAPP-A knockout in mice causes reduced bone length and growth plate chondrocyte disorganization. (A) Femoral bone length in male wild-type and knockout mice at postnatal week 4, 6 and 18. The number of mice (wild-types/knockouts males): 4 weeks, (5/5); 6 weeks (6/6); 18 weeks, (10/5). (B) Representative examples of intact femurs from wild-type or knockout PAPP-A mice at 6 weeks of age. (C) Schematic drawing indicating the positions of the growth plate germinal zone (GZ), the proliferative zone (PZ), the hypertrophic zone (HZ), and the total growth plate (GP) height. (D–G) Heights of the GZ (D), the PZ (E), the HZ (F), and the total growth plate height (G) was measured on growth plate sections stained with Masson–Goldner trichrome from 4 weeks old male Pappa wild-type (+/+) and knockout (−/−) mice. The data are based on 4 wild-type and 4 knockout mice. (H–I) Representative examples of growth plates sections from 4 weeks old male Pappa wild-type (+ / +) and knockout (−/−) mice, respectively. The boxed areas of the proliferative zone are shown at a higher magnification to the right. Note that the proliferative zone of the PAPP-A knockout shows areas devoid of chondrocytes. (J–M) Quantification of growth plate columnar organization using grid-based analysis31. The data are based on 5 wild-type and 4 knockout mice. (J) The percentage of intact columns, i.e. columns with chondrocytes continuously across the full height of the proliferative zone. (K) Cell density in the proliferative zone. (L) Column density in the proliferative zone. (M) Isolated cells ratio (CI/C), reported as the proportion of isolated cells (CI) per grid field among the total cell number (C) within a grid field (increased by 60% in Pappa knockout compared to wild-type mice). This parameter describes the quality of columnar arrangement, with a high CI/C ratio indicating a high proportion of chondrocytes not organized into columns31. Data are mean ± SD and are analyzed by unpaired two-tailed Student’s t-test. ns, p > 0.05; * p < 0.05; ** p < 0.01; *** p < 0.001; **** p < 0.0001. |
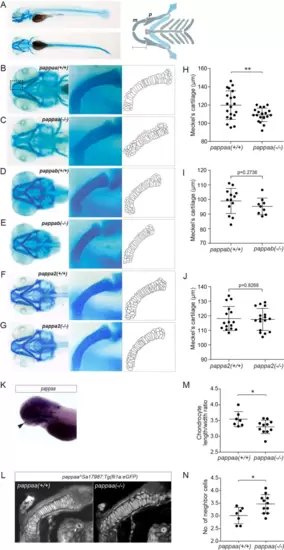
Zebrafish devoid of Papp-aa display reduced size of Meckel’s cartilage and aberrant chondrocyte morphology. (A) Lateral and ventral views of wild-type zebrafish (4 dpf) stained with Alcian blue. Schematic overview of the pharyngeal cartilage elements of the zebrafish viscerocranium is shown. As indicated, the length of Meckel’s cartilage (m) was measured from its anterior edge to the posterior edge, which articulates with the palatoquadrate (p). (B–G) Representative ventral images of pappaa, pappab, and pappa2 knockout (−/−) and wild-type (+/+) heads, as indicated, stained with Alcian blue. Magnifications of Meckel’s cartilage (boxed area in B), corresponding to the larvae shown in B-G and derived outlines of the chondrocytes are also shown. (H–J) The length of Meckel’s cartilage, measured as shown in A, for wild-type (n = 20) and knockout (n = 20) pappaa, wild-type (n = 13) and knockout (n = 9) pappab, and wild-type (n = 16) and knockout (n = 17) pappa2, respectively. (K) Expression of pappaa detected by whole mount in situ hybridization using a gene specific probe. Arrowhead mark expression in Meckel’s cartilage. (L–N) Chondrocyte morphology assessed in the transgenic zebrafish line pappaa(Sa17987);Tg(fli1a:eGFP), which expresses GFP in the craniofacial cartilage. (L) Representative confocal images of one side of Meckel’s cartilage in wild-type and knockout larvae. (M) Chondrocyte length/width ratio within the middle third of Meckel’s cartilage. (N) The number of neighboring cells of each chondrocyte within the middle third of Meckel’s cartilage (K). pappaa data are from three, pappab data are from two, and pappa2 data are from four independent experiments. (N) The number of neighboring cells of each chondrocyte (K). pappaa data are from three, and pappab data are from two independent experiments. The results are shown as mean ± SD and analyzed by unpaired two-tailed Student’s t-test. * p < 0.05; ** p < 0.01. |
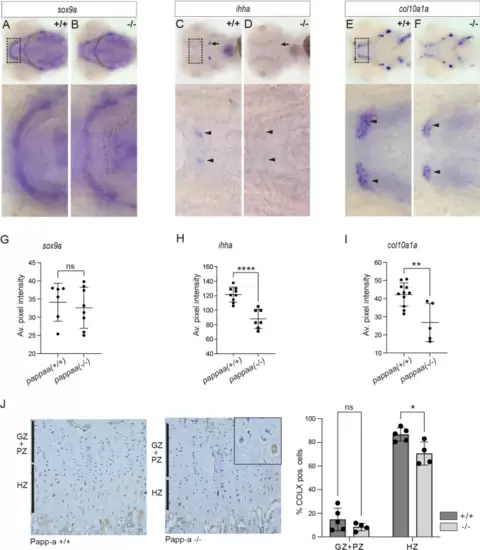
Altered expression of chondrocyte differentiation markers sox9a, col10a1a and ihha in pappaa knockout larvae. At 4 dpf, the expression of sox9a, ihha, and col10a1 was assessed in wild-type and pappaa knockout larvae by whole mount in situ hybridization. (A,B) Expression of sox9a, a transcription factor expressed during early chondrogenesis essential for initiating and maintaining chondrogenesis26. (C,D) Expression of ihha, a paracrine factor synthesized by prehypertrophic chondrocytes27. Staining of ihha in the ceratohyal (arrows) or Meckel’s (arrowheads) cartilage is indicated. (E,F) Expression of col10a1a, an ECM component synthesized by hypertrophic chondrocytes27. In zebrafish, perichondral expression has also been reported around Meckel’s cartilage (arrowheads)28. (G–I) Average intensity of the staining in Meckel’s/ceratohyal cartilage for sox9a, ihha, and col10a1a, respectively. (J) Immunostaining of growth plate sections from wild-type or PAPP-A knockout mice, as indicated (left panels) using an antibody specific for mouse COLX. Quantification of the number of COLX-positive chondrocytes is shown for the germinal and proliferative zones combined (GZ + PZ) and for the hypertrophic zone (HZ) (right panel). An example of COLX-negative and -positive hypertrophic chondrocytes in the growth plate of PAPP-A knockout mouse is shown (inset). |
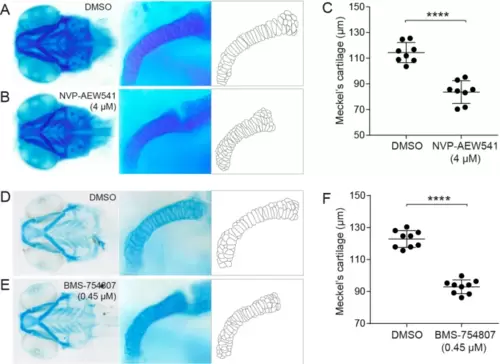
Normal morphology of Meckel’s cartilage depends on IGF signaling. (A,B) Representative images of Alcian blue-stained wild-type zebrafish larvae treated with the IGF-IR inhibitor NVP-AEW541 (4 µM) or control solution (DMSO in E3) from 3 to 4 dpf. A magnification of one side of Meckel’s cartilage and a schematic outline of the chondrocytes in Meckel’s cartilage are also shown. (C) Length of Meckel’s cartilage after control (n = 8) and NVP-AEW541 (n = 8) treatment. Data are from two independent experiments. (D–F) A similar experiment using the structurally distinct IGF-IR inhibitor BMS-75807 (0.45 µM, n = 9; control group, n = 9). Data are from three independent experiments. Results are shown as mean ± SD, and are analyzed by Student’s t-test. ****p < 0.0001. PHENOTYPE:
|
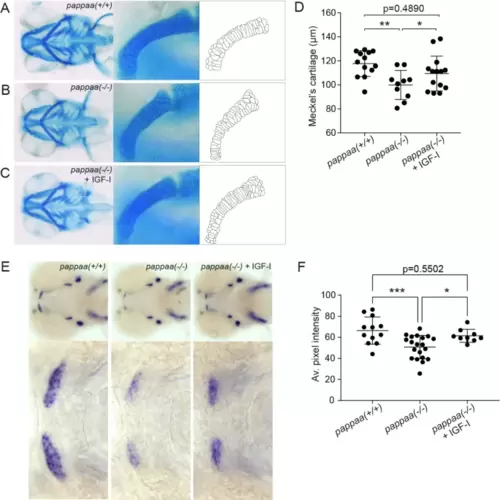
Exogenous IGF-I restores normal morphology of Meckel’s cartilage and expression of col10a1a. (A–C) 3 dpf pappaa knockout larvae were transferred to E3 buffer with or without 30 ng/mL IGF-I. At 4 dpf, the larvae were terminated, Alcian blue-stained and the length of Meckel’s cartilage was determined. Representative ventral images of nontreated and IGF-I-treated larvae, corresponding magnifications of Meckel’s cartilage, and outlines of the chondrocytes are shown. (D) Length of Meckel’s cartilage for non-treated wild-type (n = 13) or knockout (n = 10) pappaa, and IGF-I-treated knockout pappaa (n = 14). (E) Pappaa knockout larvae were treated as described in (A), and stained for col10a1a by whole mount in situ hybridization. Representative ventral images and magnifications of Meckel’s cartilage for are shown. (F) Average intensity of the col10a1a staining in Meckel’s cartilage. Data are from three independent experiments, shown as mean ± SD and analyzed by one-way ANOVA. * p < 0.05; ** p < 0.01; *** p < 0.001; **** p < 0.0001 |