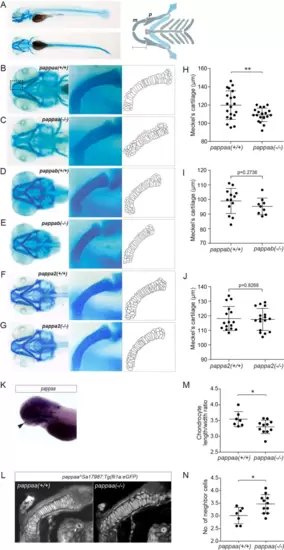
Zebrafish devoid of Papp-aa display reduced size of Meckel’s cartilage and aberrant chondrocyte morphology. (A) Lateral and ventral views of wild-type zebrafish (4 dpf) stained with Alcian blue. Schematic overview of the pharyngeal cartilage elements of the zebrafish viscerocranium is shown. As indicated, the length of Meckel’s cartilage (m) was measured from its anterior edge to the posterior edge, which articulates with the palatoquadrate (p). (B–G) Representative ventral images of pappaa, pappab, and pappa2 knockout (−/−) and wild-type (+/+) heads, as indicated, stained with Alcian blue. Magnifications of Meckel’s cartilage (boxed area in B), corresponding to the larvae shown in B-G and derived outlines of the chondrocytes are also shown. (H–J) The length of Meckel’s cartilage, measured as shown in A, for wild-type (n = 20) and knockout (n = 20) pappaa, wild-type (n = 13) and knockout (n = 9) pappab, and wild-type (n = 16) and knockout (n = 17) pappa2, respectively. (K) Expression of pappaa detected by whole mount in situ hybridization using a gene specific probe. Arrowhead mark expression in Meckel’s cartilage. (L–N) Chondrocyte morphology assessed in the transgenic zebrafish line pappaa(Sa17987);Tg(fli1a:eGFP), which expresses GFP in the craniofacial cartilage. (L) Representative confocal images of one side of Meckel’s cartilage in wild-type and knockout larvae. (M) Chondrocyte length/width ratio within the middle third of Meckel’s cartilage. (N) The number of neighboring cells of each chondrocyte within the middle third of Meckel’s cartilage (K). pappaa data are from three, pappab data are from two, and pappa2 data are from four independent experiments. (N) The number of neighboring cells of each chondrocyte (K). pappaa data are from three, and pappab data are from two independent experiments. The results are shown as mean ± SD and analyzed by unpaired two-tailed Student’s t-test. * p < 0.05; ** p < 0.01.
|
